
Figure 1. Schematic drawing showing the arrangements and orientations of genes in the mating type locus of S. trifoliorum self-fertile L mating type (G22) and self-sterile S mating type (G27) isolates.
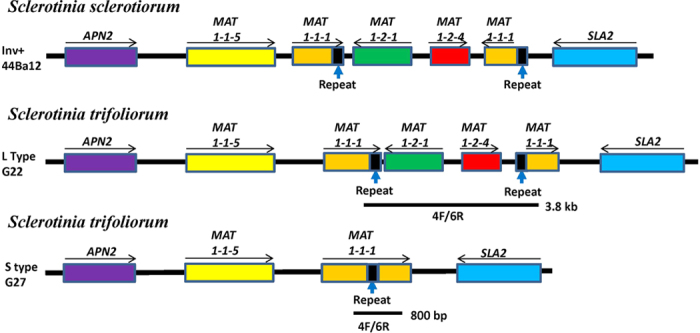
The Sclerotinia sclerotiorum Inv+ MAT allele (44Ba12, adapted from Chitrampalam et al.17) is included for comparison. Note the different orientations of the 3′ fragment of MAT1-1-1 gene. The DNA region amplified using the diagnostic primer pair 4F and 6R is indicated which will amplify 3800 bp and 800 bp in the L and S mating types, respectively. Diagram not drawn to scale.