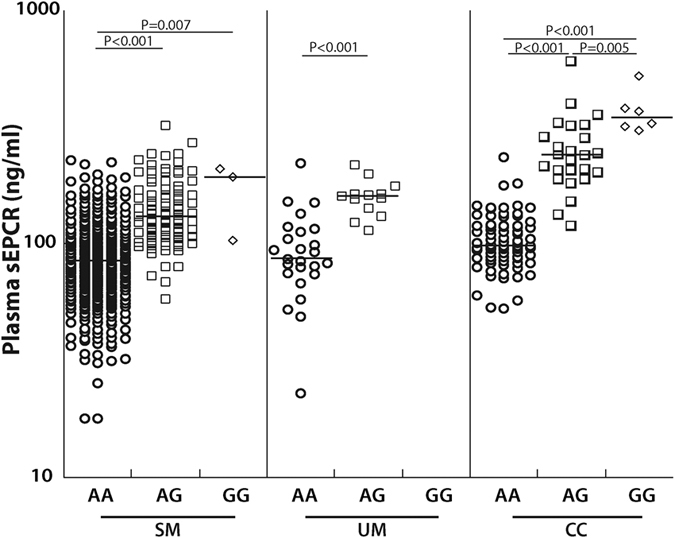
Figure 4. rs867186-G is associated with higher sEPCR level.

sEPCR levels are represented on a logarithmic scale and each disease group is separated by rs867186 genotype: AA, AG or GG. The horizontal line represents median values. Severe malaria (SM), uncomplicated malaria (UM), community controls (CC).
