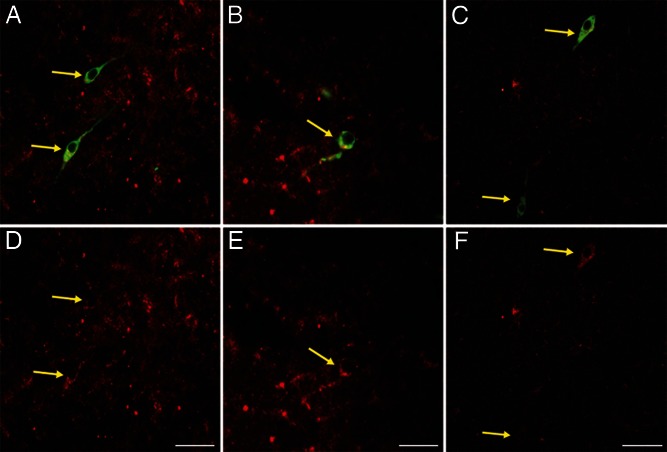
Figure 7.
Representative images of KOR colocalization in GnRH cells in the rodent POA. Light microscopy images (A and B) and confocal microscopy images (C) of tissue processed for immunofluorescent detection of KOR-ir (red) and GnRH-ir (green) cells. D, E, and F, Single-channel images displaying KOR-ir labeling. Yellow arrows denote colocalization. Scale bars, 100 μm.

