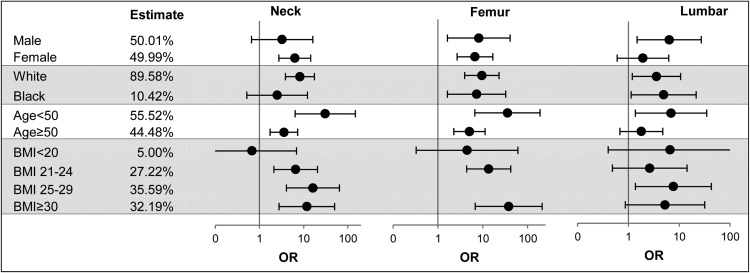
Figure 4.
OR of association of hypoalbuminemia with OP compared with albumin >4 g/dL by subgroups of age, sex, race, and BMI at different anatomical sites using logistic regression models on the weighted samples accounting for hidden variance. Note that values for the subgroup BMI of 25–29 kg/m2 at the femur are not shown due to inaccurate estimates owing to the differentially low prevalence of OP and low rate of hypoalbuminemia in that subgroup, with the net effect of inaccuracy of the estimate in that subgroup.

