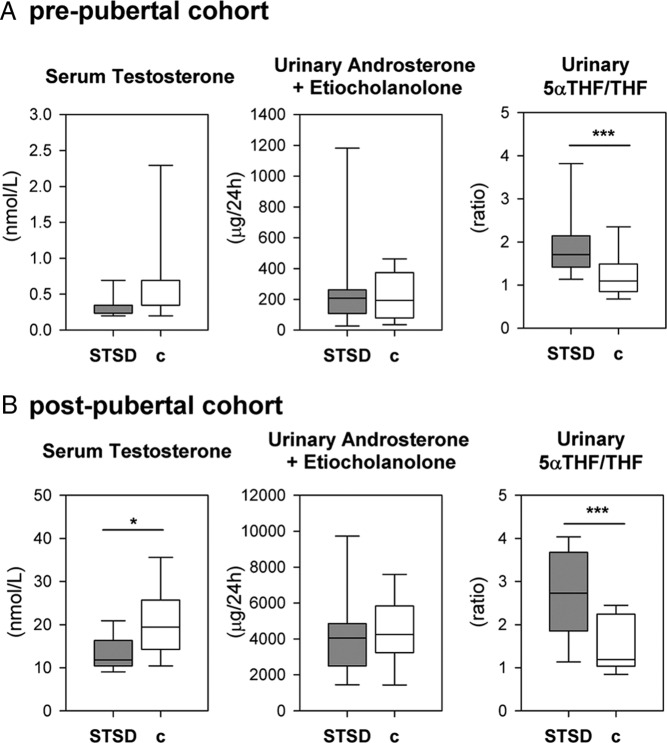
Figure 3.
Active androgens and their metabolism of patients with STSD (n = 30) compared with healthy male controls (n = 38). Box and whisker plots depicting median, interquartile range, and 10th–90th percentile are used to visualize serum testosterone (left), the sum of 24-hour urinary excretion of the active androgen metabolites androsterone and etiocholanolone (middle), and the ratio of urinary 5αTHF to THF reflective of net 5α-reductase activity (right). A, Data for the prepubertal subjects (STSD, n = 13; controls, n = 15). B, Results in the postpubertal subgroup (STSD, n = 12; controls, n = 19).

