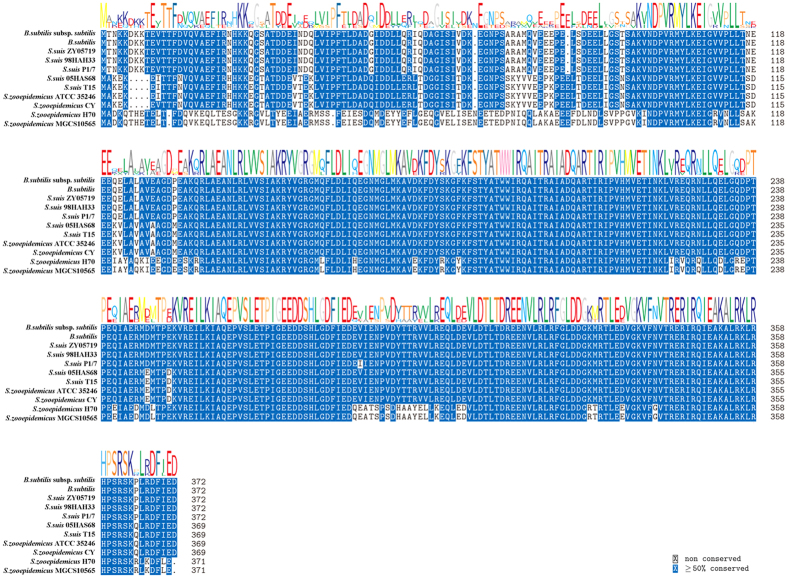
Figure 1. Homology analysis of the SigA protein from B. subtilis and the RopD protein from SS2 and SEZ.
Position weight matrix (PWM) of each amino acid is shown with the alignment results. Amino acids with greater than 50% conservation are shown in blue. RopD from five SS2 strains and four SEZ strains were chosen to compare with the SigA of Bacillus subtilis.

