
FIG. 1.
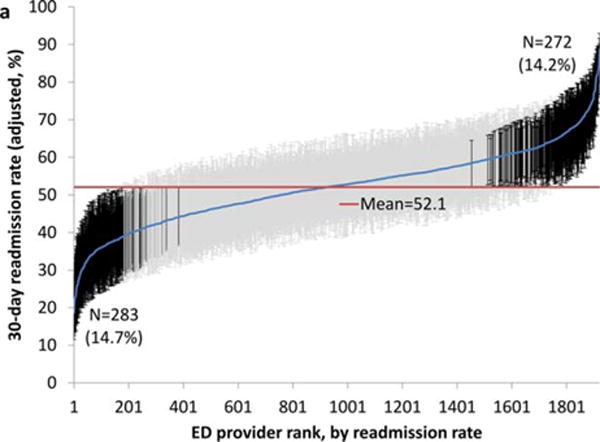
Ranking of emergency department (ED) provider by adjusted readmission rate: readmission on the day of or day after ED visit. Rates were estimated by 2-level analyses, adjusted for patient characteristics. The horizontal line represents the overall mean. Error bars represent 95% confidence intervals of the estimate for the individual ED provider. Black error bars represent ED providers with significantly higher or lower estimates. [Color figure can be viewed in the online issue, which is available at wileyonlinelibrary.com.]