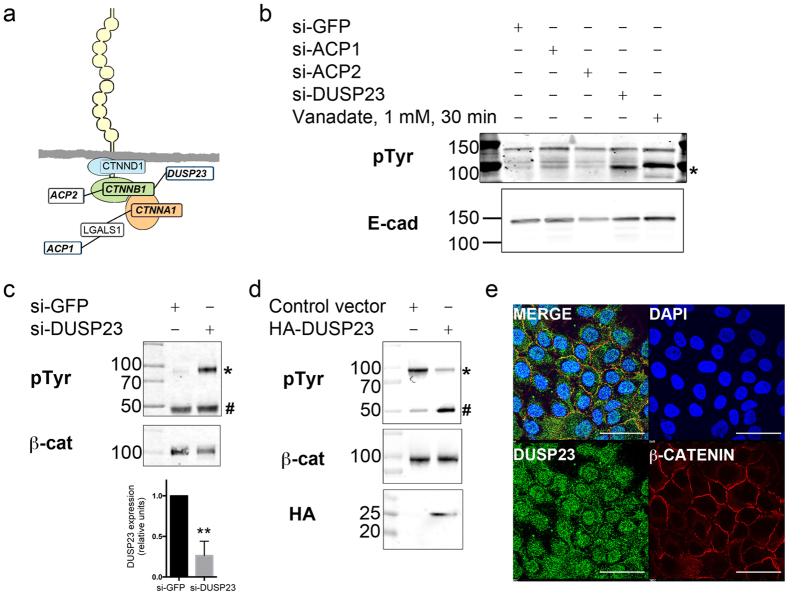
Figure 3. DUSP23 regulates Tyr phosphorylation of β-catenin and co-localizes with it at cell-cell junctions.
(a) Diagram of connections between the cadherin-catenin complex and three Tyr phosphatases. (b) Analysis of changes in Tyr phosphorylation of E-cadherin-associated proteins. E-cadherin was immunoprecipitated from cells transfected with siRNA to GFP (negative control), ACP1, ACP2, and DUSP23, or from cells treated with Vanadate (positive control). Blots were probed with anti-E-cadherin (bottom) or anti-pTyr antibody (top). *Denotes pTyr band in the DUSP23 knockdown lane at 100 kDa. (c) Immunoblot analysis of pTyr β-catenin immunoprecipitated from MCF10A cells treated with siRNA to GFP or siRNA smartpool to DUSP23; blots were probed with anti-pTyr (top) or anti-β-catenin (bottom) antibody. DUSP23 knockdown was monitored by QPCR (bottom graph). *Denotes pTyr signal and #denotes cross-reactive IgG protein. Immunoblots are representative of 3 experiments. Graph is a quantification of 2 independent experiments carried out in triplicate. Error bar indicates S. D. **p < 0.03. (d) Immunoblot analysis of pTyr of β-catenin immunoprecipitated from MCF10A cells expressing control plasmid or HA-tagged DUSP23; blots were probed with anti-pTyr (top), anti-β-catenin (middle), or anti-HA (bottom) antibody. *Denotes pTyr signal and #denotes cross-reactive IgG protein. Immunoblots are representative of 3 experiments. (e) Immunofluorescence staining of MCF10A cells using rabbit antibody to DUSP23 (green, lower left) and mouse antibody to β-catenin (CTNNB1, red, lower right). DAPI (upper right) stains the nuclei, and merged image (top left) shows co-localization of DUSP23 with β-catenin. Scale bar represents 50 µm.

