
Fig. 1.
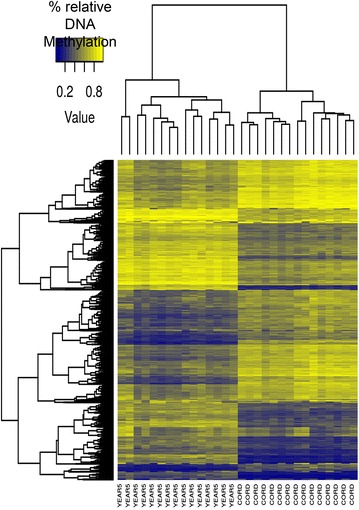
Clustered heatmap showing the methylation levels across all samples for the hyper- and hypo-methylated CpG sites. Methylation levels range from dark blue (no methylation) to light yellow (100 % methylated). Dendrograms were computed using Euclidean distance and a complete cluster agglomeration method. Both age groups are clustered correctly and methylation values have a homogeneous intra-group profile. YEAR5 stands for samples of DNA isolated from blood that was collected from individuals when they were 5 years-old. CORD stands for samples of DNA isolated from cord blood that was collected at birth from the same individuals