
Fig. 1.
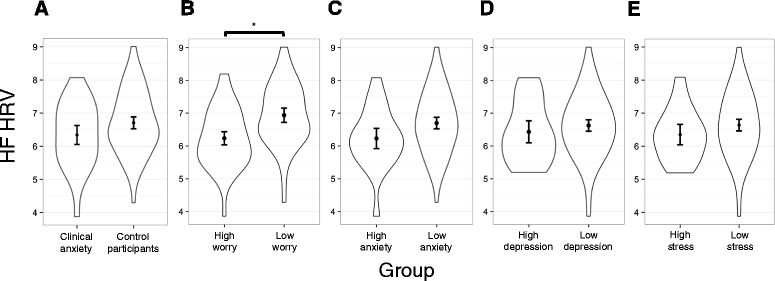
Violin plots with means and 95 % confidence intervals for HF-HRV. The following variables categories are shown: Clinically anxious vs. Control participants (a), Low vs. High worry (b), Low vs. High anxiety (c), Low vs. High depression (d), and Low vs. High stress (e). Violin plots illustrate the distribution of data by showing the probability density of the data at different values. HF-HRV = Absolute high frequency HRV. *p < 0.001