
Fig. 3.
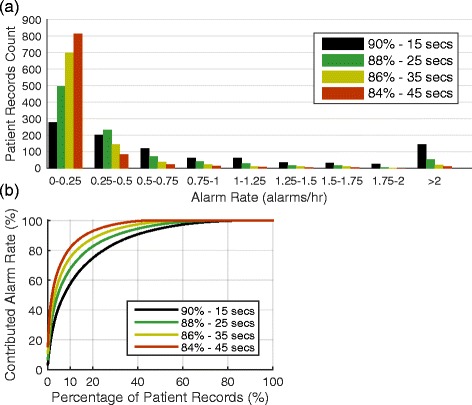
Distribution of patient alarm rates. a Histogram of the number of patient records at each alarm rate for four different settings. b The number of records accounting for the percentage of total alarm rate. For example, at a threshold of 84 % and delay of 45 s 10 % of patients account for over 80 % of all alarms