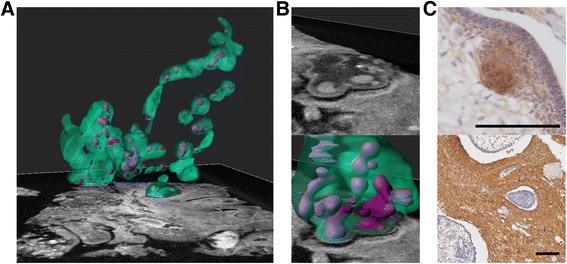
Fig. 2.

a Three dimensional annotation of an area of case 1. Green indicates the border of tumour demonstrating nodules and islands with some interconnections. Connections of less than 5 μm will not be well visualised at this resolution, possibly explaining discontinuities. Purple indicates epithelial whorls/clusters. b An area of finger-like protrusions. The upper panel shows the micro-CT image; the lower panel shows 3D annotation revealing a complex 3D structure in this region. c Immuno-histochemical staining of the post micro-CT samples in (A) demonstrating appropriate antigenic reactivity following iodination. Upper panel beta-catenin showing a cluster with nucleo-cytoplasmic accumulation (case 3), lower panel glial fibrillary acidic protein (GFAP) (case 1). Scale bars indicate 100 μm
