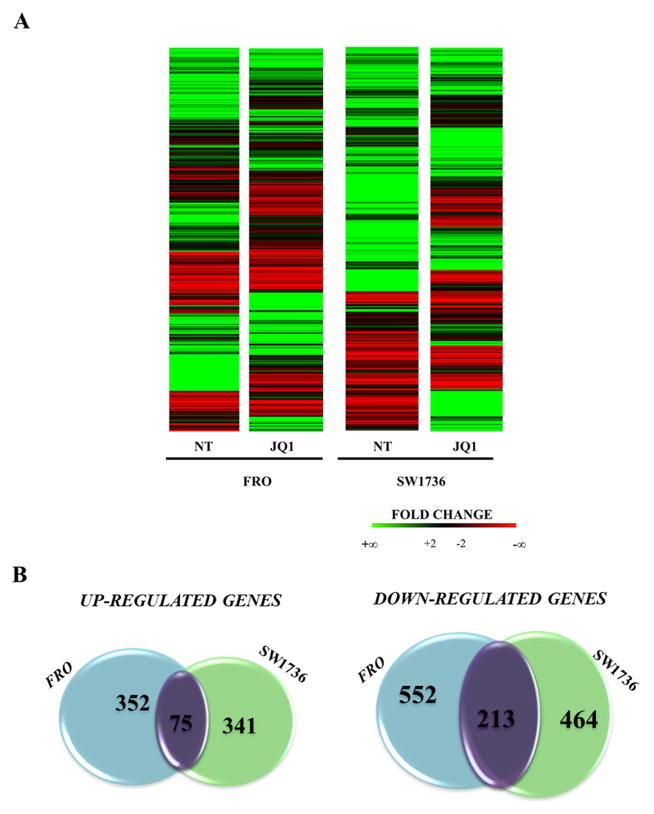
Figure 2. Gene expression modifications in ATC JQ1-treated cell lines.
Panel A; Heat maps showing the hierarchical clustering of mRNA targets in FRO and SW1736 cell lines (N=1997). Cells were treated either with 5 μM JQ1 or vehicle for 24 hours. Panel B; Venn diagrams representing the comparison of both up-regulated (left) and down-regulated (right) genes between FRO and SW1736 cell lines after RNA-seq data analysis. Purple gene clusters represent shared modified genes between FRO and SW1736 cell lines.

