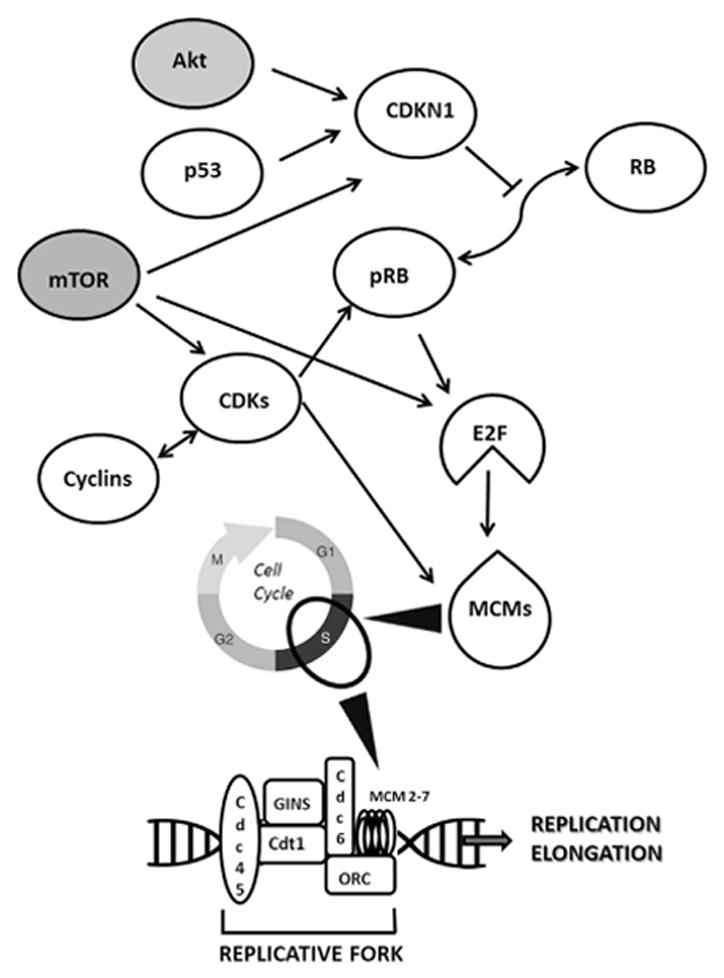
Figure 6. Biological network related to MCMs protein function.

Network diagram (upper part) showing key molecules controlling MCMs protein levels. White symbols represent proteins whose mRNA levels are modulated by BET inhibitors in our transcriptome analysis (see Supplementary Table 4); gray symbols indicate proteins whose mRNA levels are not modulated by BET inhibitors. Arrows indicate functional relationship between proteins (delineated in Guida et al. 2005; Abe et al. 2012; Madine et al. 2000; Laskey 2005). The lower part indicates factors cooperating with MCM proteins in the replicative fork assembly. All of these factors are down-regulated by BET inhibitors (see Supplementary Table 4). Arrowheads show the relationship between MCMs and cell cycle phases.
