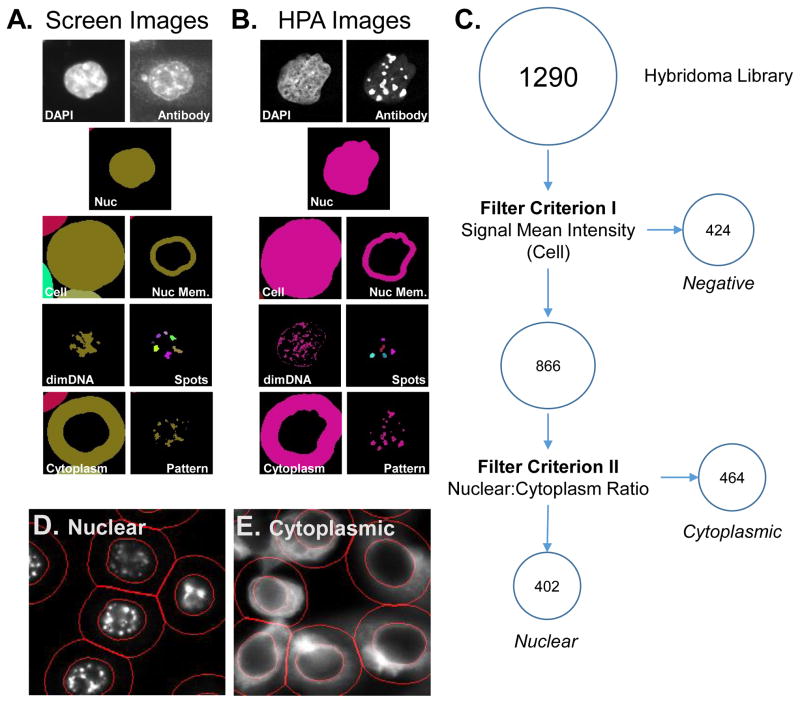
Figure 2. Workflow for HCA analysis of image data sets associated with nuclear matrix hybridoma screening.
The hybridoma screening (A) or HPA reference set (B) image sets were analyzed using the myImageAnalysis application to identify nuclear (Nuc), cellular (cell), nuclear membrane (Nuc Mem), cytoplasmic (Cytoplasm) regions and DNA poor regions (dimDNA) from the DAPI images for each cell. In addition, the antibody/hybridoma signal was used to define bright spots (spots) and a general pattern (pattern) masks. (C) A schematic overview of a criterion-based strategy used to initially characterize the labeling observed with hybridoma supernatants. The mean pixel intensity per cell (Criterion I)was used to define positive and negative clones. The ratio between nuclear mean pixel intensity to cytoplasmic mean pixel intensity (Criterion II) was used to define nuclear and cytoplasmic clones. Example images of pattern classified as nuclear (D) or cytoplasmic (E) using the above criterion. Red lines indicated identified nuclear and cell regions.

