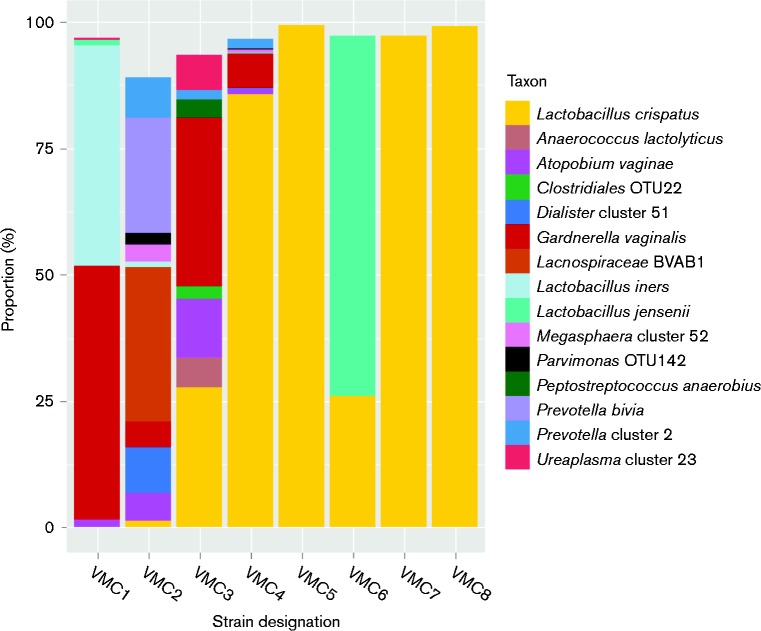
Fig. 1.
Microbiome of samples used for isolation of L. crispatus. Microbial profiles for each of the eight subjects chosen for isolation of L. crispatus are shown. The y-axis represents the prevalence of different bacterial taxa as a function of percentage of total reads of the 16S rRNA gene. Only bacterial taxa representing ≥ 2 % of the reads from 16S rRNA gene surveys are shown. The x-axis labels are the strain designations given to the L. crispatus isolates chosen from each vaginal swab sample for study.

