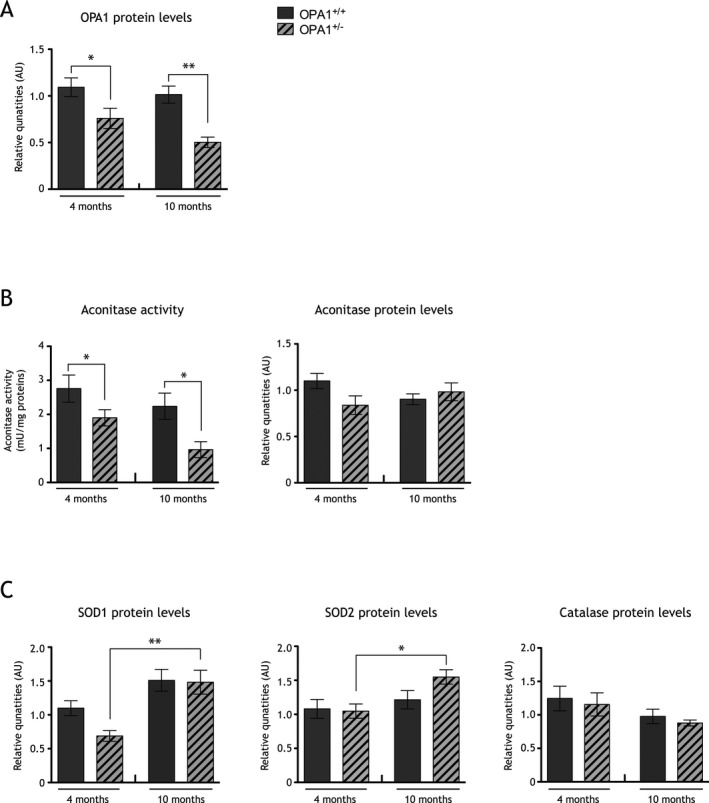
Figure 1.

Redox state is imbalanced in a dominant optic atrophy (DOA) mice model. (A) Histograms representative of OPA1 protein quantities, assessed by immunoblot, in cortices of 4 and 10 months old control mice (gray bars) and Opa1 +/− mice (striped bars). OPA1 quantities are significantly decreased in both Opa1 +/− 4 (0.70 ± 0.10 arbitrary units [AU]) and 10 (0.50 ± 0.05 AU) months old mice when compare to 4 (1.09 ± 0.10 AU) and 10 (1.01 ± 0.09 AU) months old Opa1 +/+ mice. Results are expressed as mean ± standard error of the mean (SEM) for 4 and 10 months old mice (n = 6–9). Statistical significance was determined by a two‐way analysis of variance (ANOVA), *P < 0.05, **P < 0.01. (B) Histogram representative of aconitase activities in cortices of 4 and 10 months old Opa1 +/− (striped bars) and Opa1 +/+ control mice (gray bars) cortices. Aconitase activity is significantly lower in 4 (1.56 ± 0.11 mU/mg) and 10 (0.97 ± 0.23 mU/mg) months old Opa1 +/− mice when compared to 4 (2.95 ± 0.40 mU/mg) and 10 (2.24 ± 0.38 mU/mg) months old control Opa1 +/+ mice, respectively. Aconitase proteins quantities are unchanged in DOA mice model's cortices. Results are expressed as mean ± SEM (n = 9 for 4 months old mice and n = 6 for 10 months old mice). Statistical significance was determined by a two‐way ANOVA, *P < 0.05. (C) Histogram representative of SOD1, SOD2, and catalase proteins quantities relative to actin, assessed by immunoblot, in 4 and 10 months old Opa1 +/− (striped bars) and Opa1 +/+ (gray bars) mice cortices. SOD1 proteins quantities are significantly increased in 10 months old (1.48 ± 0.17 AU) Opa1 +/− mice compared to 4 months old (0.76 ± 0.08 AU) Opa1 +/− mice. Likewise, SOD2 proteins quantities are significantly increased in 10 months old (1.55 ± 0.11 AU) Opa1 +/− mice compared to 4 months old (0.98 ± 0.09 AU) Opa1 +/− mice. Catalase quantity is unchanged in Opa1 +/+ and Opa1 +/− 4 and 10 months old mice. Results are expressed as mean ± SEM (n = 9 for 4 months old mice and n = 6 for 10 months old mice). Statistical significance was determined using a two‐way ANOVA, *P < 0.05, **P < 0.01.
