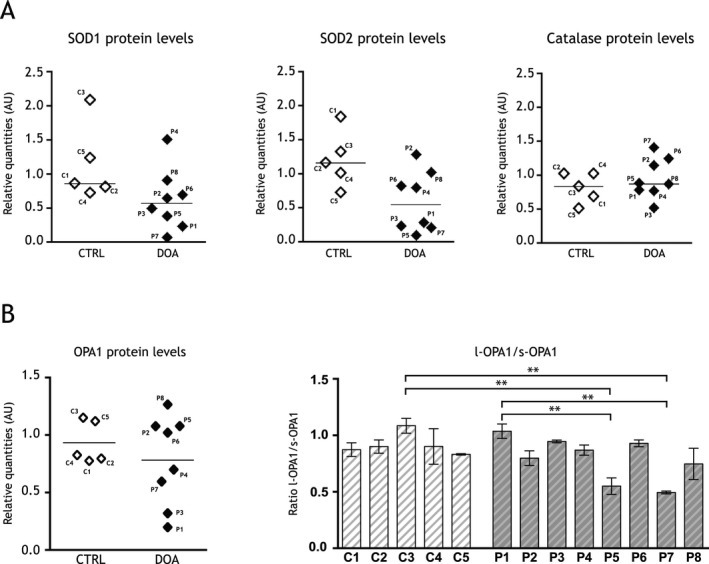
Figure 4.

Antioxidant defenses and OPA1 proteins levels in fibroblasts from dominant optic atrophy (DOA) patients. (A) Representative histograms of SOD1, SOD2, and catalase proteins levels relative to actin in five healthy volunteer's skin fibroblasts (CTRL, C1–C5) and eight DOA patient's skin fibroblasts (DOA, P1–P8) ex vivo. SOD1 CTRL: 1.15 ± 0.25 AU; SOD1 DOA: 0.62 ± 0.16 AU; SOD2 CTRL: 1.21 ± 0.19 AU; SOD2 DOA: 0.59 ± 0.16 AU; catalase CTRL: 0.82 ± 0.10 AU; catalase DOA: 0.96 ± 0.10 AU. Results are expressed as mean ± SEM (n = 3–6 per DOA and CTRL fibroblasts). (B) Representative histograms of OPA1 protein levels relative to actin in five healthy volunteer's skin fibroblasts (CTRL, C1–C5) and eight DOA patient's skin fibroblasts (DOA, P1–P8) ex vivo. Histogram representative of the ratio of the long (l‐OPA1) to the short (s‐OPA1) OPA1 isoforms. Results are expressed as mean ± SEM (n = 3–6 per DOA and CTRL fibroblasts) Statistical significance for the ratio of the long to the short OPA1 isoforms was determined by a one‐way analysis of variance (ANOVA), **P < 0.01.
