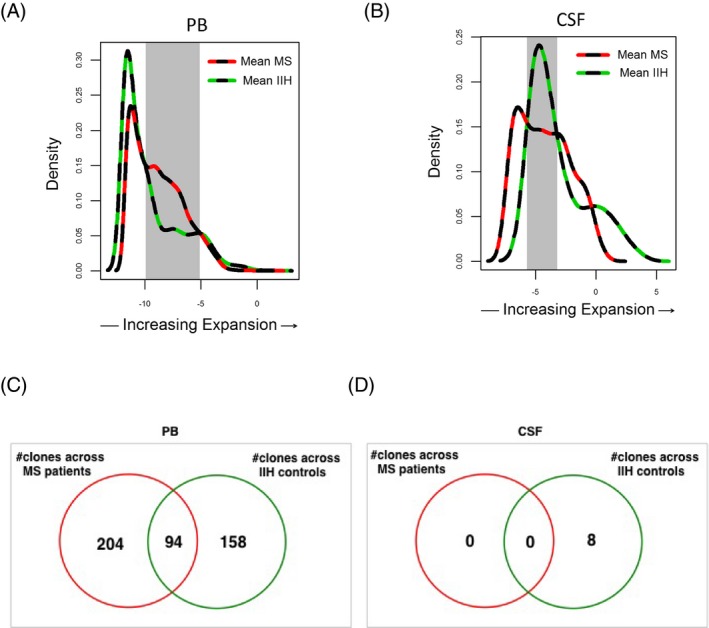
Figure 4.

Distribution of expanded T‐cell clonotypes in the peripheral blood and cerebrospinal fluid (CSF) of multiple sclerosis (MS) patients and idiopathic intracranial hypertension (IIH) controls. Clonotype distribution as a function of expansion in the peripheral blood (PB) (A) and CSF (B) of MS patients (dashed red line) and IIH controls (dashed green line). Subsets of differentially expanded clones in PB (from −9.9 to −5.1 log frequency; gray shading) and CSF (from −5.7 to −3.2 log frequency; gray shading) were selected for phylogenetic tree analysis (Fig. 5). Number of shared clonotypes by CDR3 amino acid sequence across MS patients and IIH controls in PB (C) and CSF (D).
