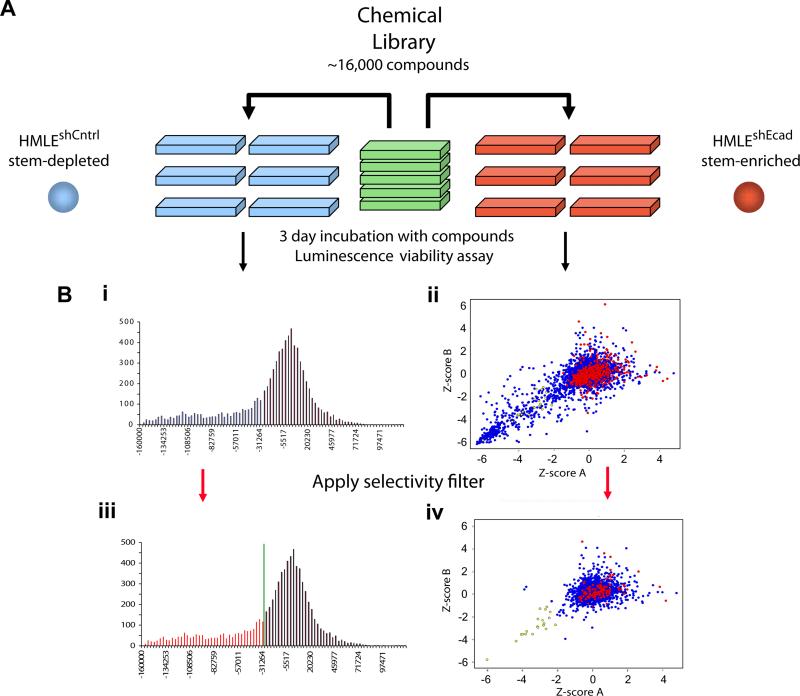
Figure 2. Chemical screening for compounds that selectively kill mesenchymally transdifferentiated immortalized epithelial cells.
(a) Schematic of the screen design and protocol. (b) (i) Histogram of replicate-averaged background-corrected viability signal intensities (see Methods for details) for the viability of each tested compound for control breast epithelial cells (HMLEshCntrl). Low/high signal intensities indicate compounds that reduce/increase cell viability. (ii) XY-Scatter plot of normalized Z-scores for the viability of each tested compound for mesenchymally transdifferentiated breast epithelial cells (HMLEshEcad; red dots indicate DMSO treatment; blue dots indicate test compounds). Z-scoreA and Z-scoreB represent the normalized Z-scores for the two independent replicates of the screen. (iii) The data are as in (i) with the red shaded region in the histogram representing compounds that exhibited mild-to-strong toxicity (>1 S.D. lower than the mean normalized signal intensity) for the control HMLEshCntrl epithelial cells. Compounds within the red region in (iii) were filtered out of the plot in (ii), producing the scatter plot in (iv). Application of this selectivity filter resulted in the identification of compounds that selectively killed mesenchymally transdifferentiated HMLEshEcad but not control HMLEshCntrl epithelial cells (yellow dots).

