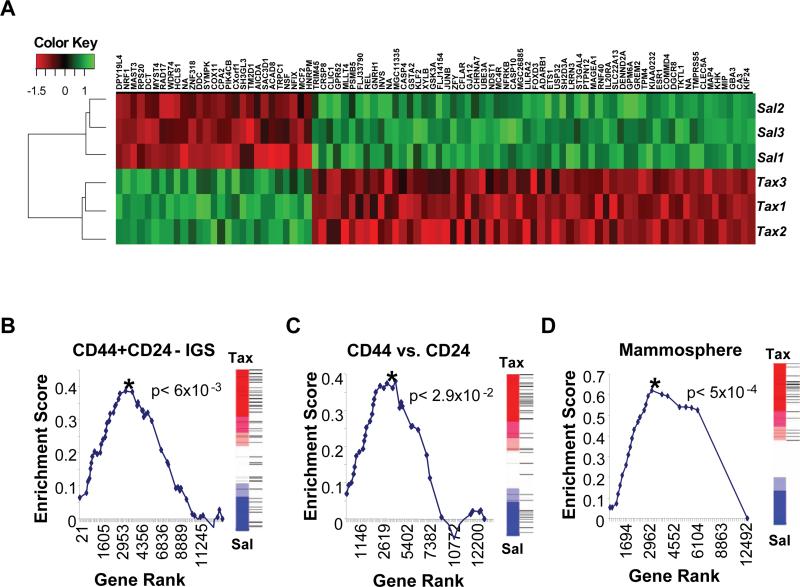
Figure 6. Salinomycin and paclitaxel treatment affect expression of CSC genes associated with poor patient prognosis.
HMLER cells were treated in triplicate with either salinomycin or paclitaxel and then subjected to microarray gene expression analysis. (a) Genes showing differential expression (|t-statistic| > 5) between salinomycin (Sal) and paclitaxel (Tax) treatment conditions were plotted on the Heatmap using the Euclidean distance measure. (b,c,d) Salinomycin treatment reduces the expression of clinically relevant breast CSC and progenitor genes. Gene set enrichment analysis was used to determine whether the previously reported (b) CD44+CD24− IGS (Liu et al., 2007), (c) CD44+CD24− (Shipitsin et al., 2007) or (d) Mammosphere (Dontu et al., 2003) gene sets were repressed in response to salinomycin in comparison with paclitaxel treatment. Graphed are the Kolmogorov-Smirnov enrichment scores versus Gene ranks based on differential expression. P-values reflecting statistical significance for each analysis are shown. The rank of each gene in the gene set relative to the differential expression between salinomycin and paclitaxel treatment are shown as horizontal lines in the vertical bars next to each graph.

