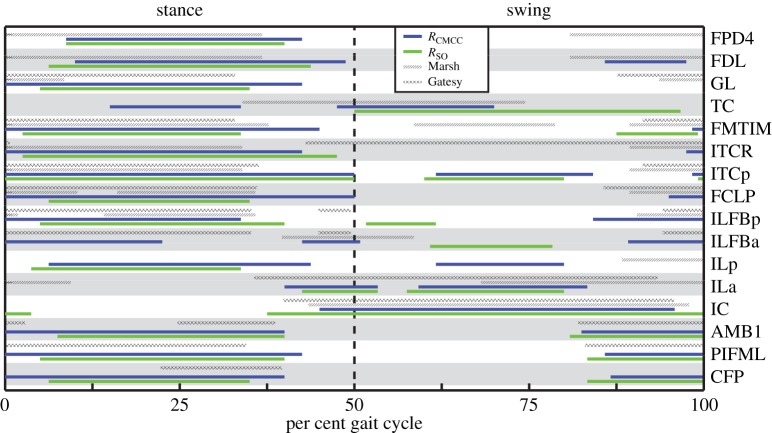
Figure 3.
Example simulated muscle excitation timings during running. Blue (dark grey) and green (light grey) bars indicate periods of excitation for the RSO and RCMCC solutions, respectively. For comparison, onset and offset timing obtained from EMG studies of guinea fowl during slower [20] (Gatesy, 1.0 m s−1, hatched bars) and faster [21] (Marsh, 1.5 m s−1, striped bars) running are provided. Owing to differences in stance and swing times between the studies, stance and swing phases were normalized to 50% of the gait cycle. Zero per cent (0%) of gait cycle indicates the beginning of the stance phase. The other four simulations had similar excitation patterns.

