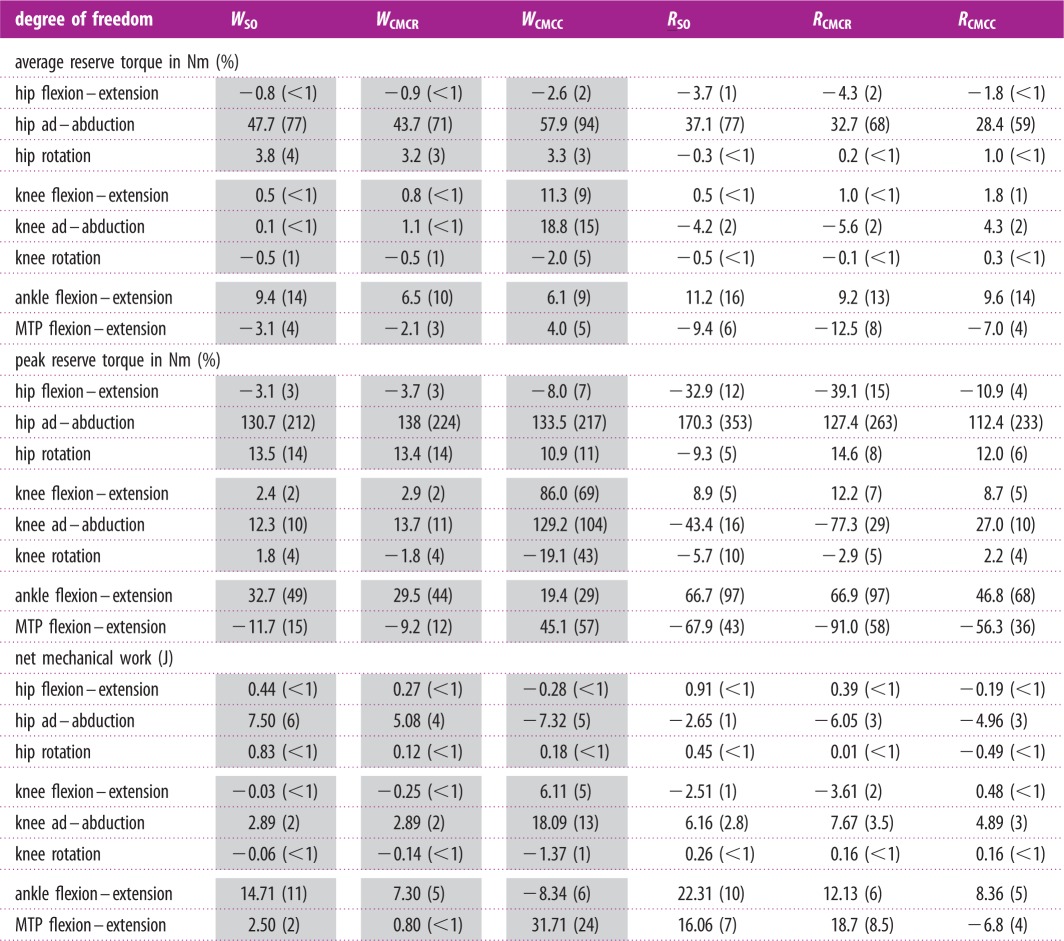
Table 3.
Average and peak moments as well as net mechanical work generated by the reserve actuators for each of the six simulations. Shaded columns are for the three walking simulations. Moment values are presented in Nm and parenthetical values indicate the per cent of the inverse dynamic analysis joint torque. Work values are presented in joules (J) and parenthetical values are percentages relative to the total muscle–tendon unit mechanical work generated in each simulation. Positive values indicate hip/knee extension, adduction and medial rotation, and ankle/MTP flexion moments. Positive/negative mechanical work indicates energy being added/removed from the limb.
 |
