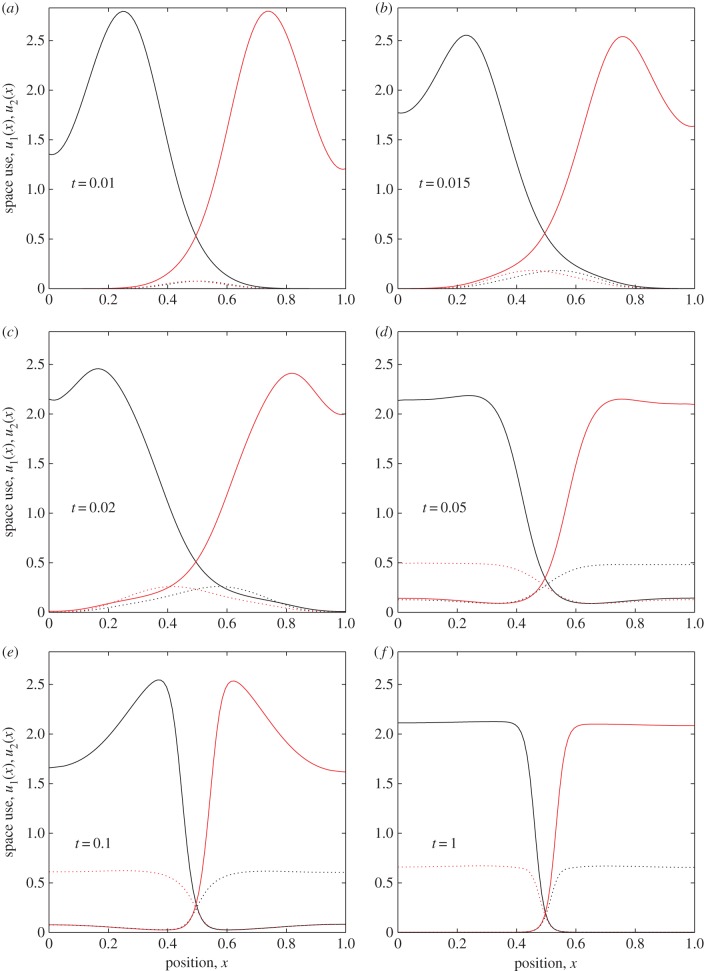
Figure 3.
Transient territorial dynamics. Time-dependent solutions to equations (2.10)–(2.13) for a = 0.01, b = 1, γ = 10, δ = 0.05 and m = 0. The value of t is given in each plot, so time increases from panel (a) to (f). Analagous to figure 2, in each plot u1(x, t) (respectively, u2(x, t)) is given by a red (respectively, black) solid curve and k1(x, t) (respectively, k2(x, t)) by a red (respectively, black) dashed curve. (Online version in colour.)

