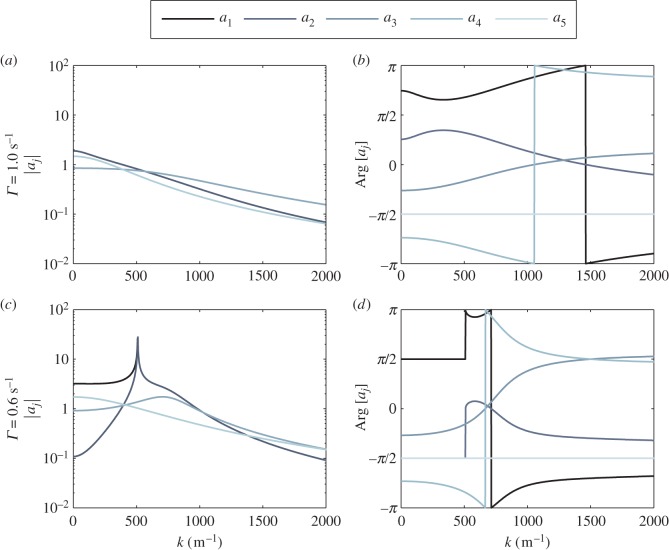
Figure 8.
Behaviour of aj(k) as a function of k using vβ = 1 mm s−1 and different Γ. Decreasing colour shade from dark to light represents data for a1, a2, a3, a4 and a5, respectively. (a) |aj| when Γ = 1.0 s−1, (b) Arg[aj] when Γ = 1.0 s−1, (c) |aj| when Γ = 0.6 s−1 and (d) Arg[aj] when Γ = 0.6 s−1. Note that for panel (a), the curves of a1 and a3 are exactly underneath a2 and a4, respectively, for all k. For panel (c), a3 is exactly underneath a4 for all k while a1 superimposes with a2 for k ≥ kc ≈ 510 m−1. (Online version in colour.)

