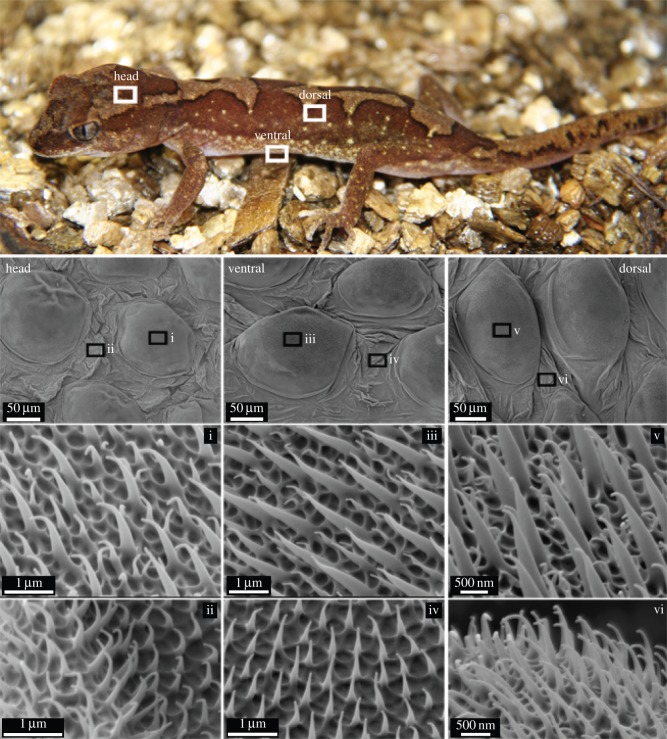
Figure 1.
SEM images of the microstructure on the dorsal, head and ventral regions of the gecko. The regions marked i, iii and v show images of the scale regions at various magnifications. The regions marked ii, iv and vi show images of the trough regions (between scales). The scale regions show an array of spinules of varying heights (two distinct size ranges) while the trough regions exhibited spinules of a consistent height. (Online version in colour.)

