Figure 3.
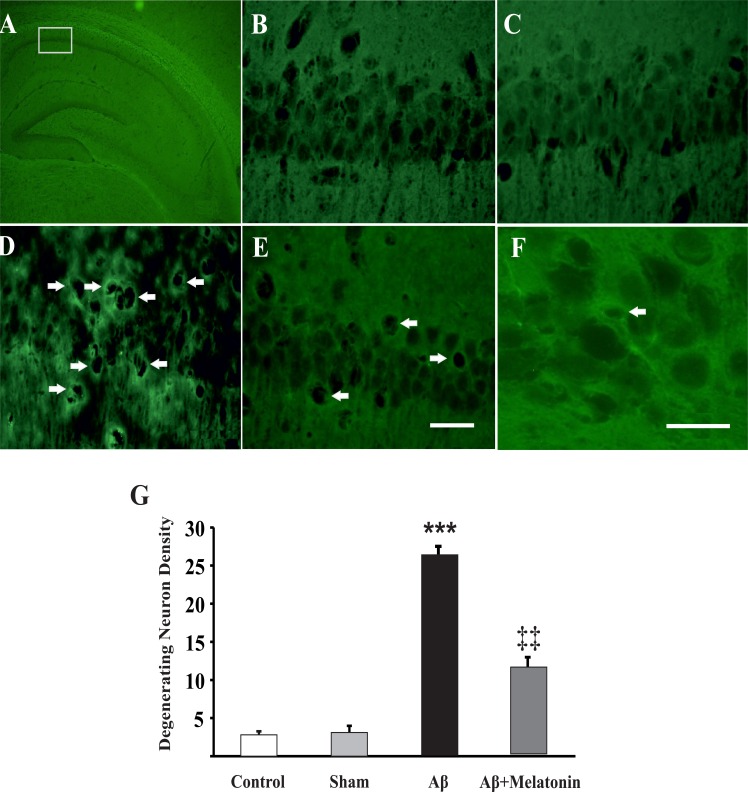
Injection of Aβ into frontal cortices induced neurodegeneration. Fluoro-jade photomicrographs of the whole hippocampus (A), CA1 pyramidal neurons of control (B), sham (C), Aβ treated (D), and Aβ+melatonin treated rats (E). Higher resolution image of fluorescent neurons from an Aβ treated rat (F). Arrows show degenerating fluorescent neurons. Scale bars show 50 μm for B-E and 20 μm for F. G) Quantitative analysis of the number of fluorescent neurons in different groups. ***P<0.001 and ‡‡P=0.005 indicate comparisons with control and Aβ groups, respectively. Analysis was done by one-way ANOVA with Turkey post-hoc test.

