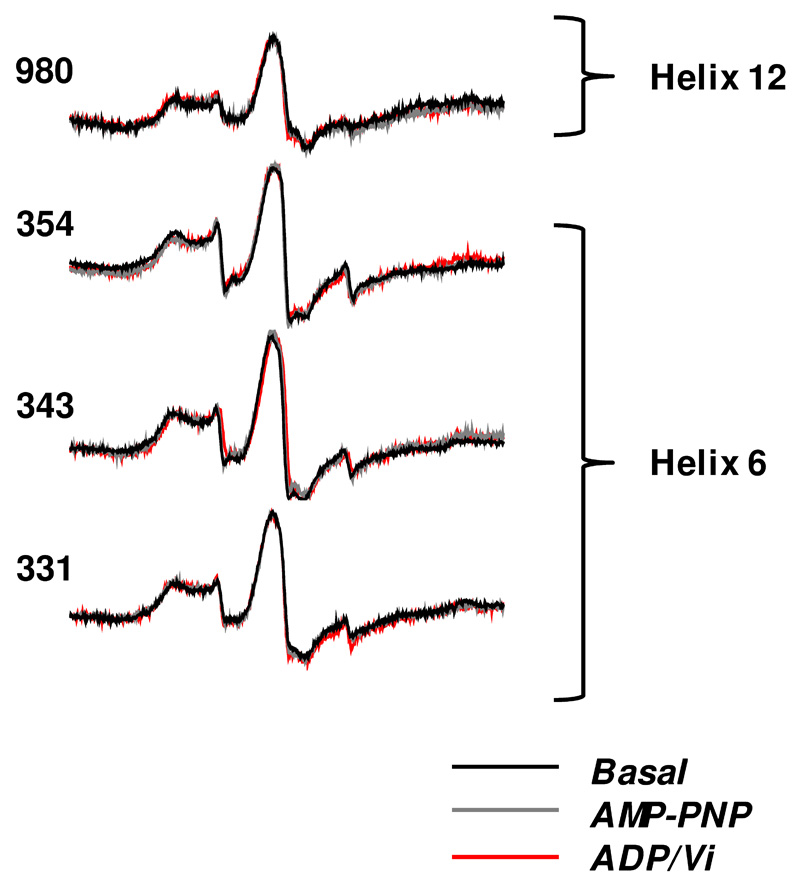
Figure 2. cw-EPR spectra of MTSL-labelled ABCB1 in different conformational states.
EPR spectral line shapes of ABCB1 containing the nitroxide side chain at the indicated sites in different conformational states: basal (black trace), AMP-PNP bound (grey trace) and ADP/Vi bound (red trace). Traces have been normalised for each isoform.

