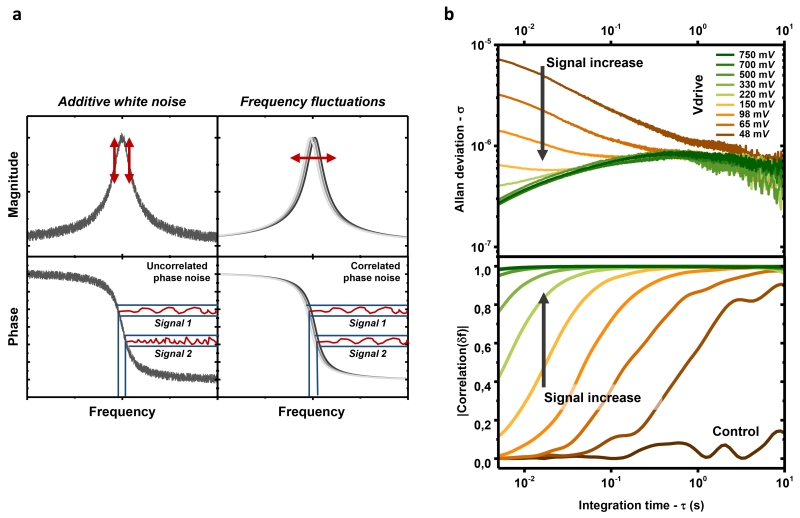
Figure 4. The limit in frequency stability of our silicon resonators is due to frequency fluctuations.
a, The resonator was actuated at two different frequencies within its bandwidth, typically at ±1 kHz from the central resonance frequency. The stability of each independently-obtained frequency trace was estimated from the open-loop phase information (f(t) ∝ ϕ(t) for small deviations from the resonance frequency). An additive white noise source is uncorrelated at different frequencies. Response signals measured at different frequencies within the bandwidth are then also uncorrelated. In contrast, frequency fluctuations shift the whole frequency response of the resonator. Response signals measured at different frequencies are then strongly correlated. b, (top) Allan deviation of one of the frequency traces obtained using this measurement method. The other trace presents very similar stability results (Supplementary Figure S10). The results are consistent with the single-frequency measurements shown in Figure 2c. (bottom) Correlation between the two simultaneous frequency traces for the same sample set. As expected, the correlation was weak when the noise was dominated by additive phase noise (low drive amplitudes), but the correlation was high at long integration times. This time range depends on the drive level. The “control” curve shows the same experiment performed out of resonance, at maximum drive voltage. These results indicate the existence of fluctuations of the whole frequency response of the resonator, i.e., frequency fluctuations.

