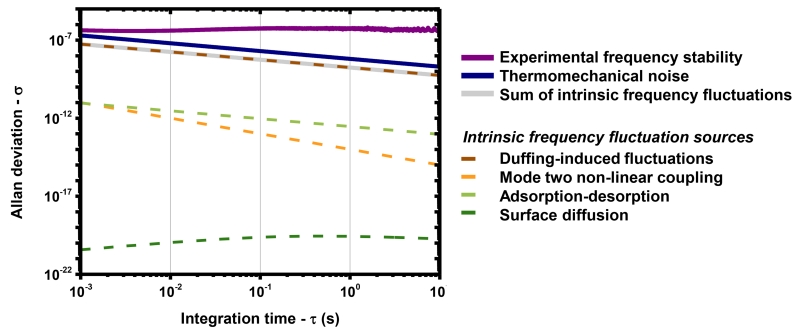
Figure 6. Known sources of frequency fluctuations.
The frequency fluctuations caused by different sources of noise, and comparison with the thermomechanical noise limit (thick blue line) and experimental results (thick violet line) were estimated in a clamped-clamped beam resonator. Frequency fluctuations arising from adsorption-desorption and surface diffusion were calculated using theoretical models. Thermomechanical noise is also a source of frequency fluctuations, through Duffing non-linearity. The coupling between the amplitude of motion of mode 2 and the resonance frequency of mode 1 was experimentally characterized, and the thermomechanical noise-induced vibrations of mode 2 are measured to quantify the resulting frequency fluctuations. The thick gray line indicates the sum of fluctuations due to these four sources of frequency fluctuations. This level of fluctuation is lower than the thermomechanical noise limit, and orders of magnitude lower than the experimental frequency instability.

