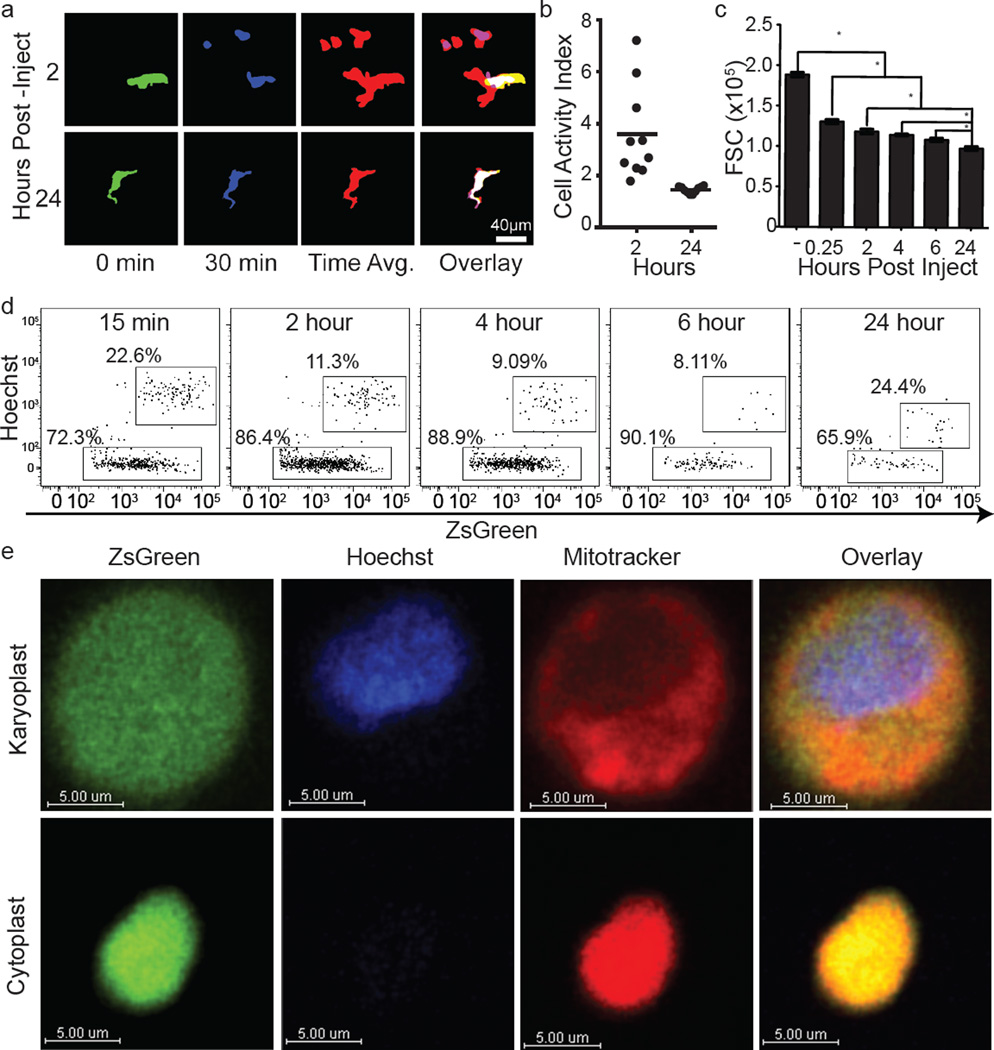
Extended Data Figure 3. Assessment of tumour cell activity and cytoplast characterization.
a, Binarized maximum intensity projections of representative cells at 2 or 24 h after injection. Cells were time-projected over a 30 min window to assess overall cellular activity during the interval. Images show the beginning time point (0 min), the ending time point (30 min), the time projection, and the overlay. White-filled space in the overlay represents the region of the cell that was stable during the analysed interval. These data are associated with Supplementary Video 3. These data are representative from imaging performed in 3 mice. b, Quantification of the cell activity index (defined as the area calculated from the projection of all positions over time as a ratio of the common area over all time (for example, area of overlap)) from analysis in d (n = 10 cells per group, horizontal bars are mean value). c, Flow cytometric quantification of FSC for tumour cells isolated from lung via digestion at 15 min, 2 h, 4 h, 6 h, and 24 h after injection. *P < 0.05, one-way ANOVA with Bonferroni post-hoc test, error bars are standard deviation. d, Representative data from flow cytometric discrimination of nucleated karyoplasts and anucleate cytoplasts derived from B16ZsGreen tumour cells in the lung in vivo over a 24 h time course, full data set quantified in Fig. 1e. e, confocal analysis of Hoechst and Mitotracker-labelled B16ZsGreen karyoplasts and cytoplasts sorted from in vitro culture of B16ZsGreen cells.

