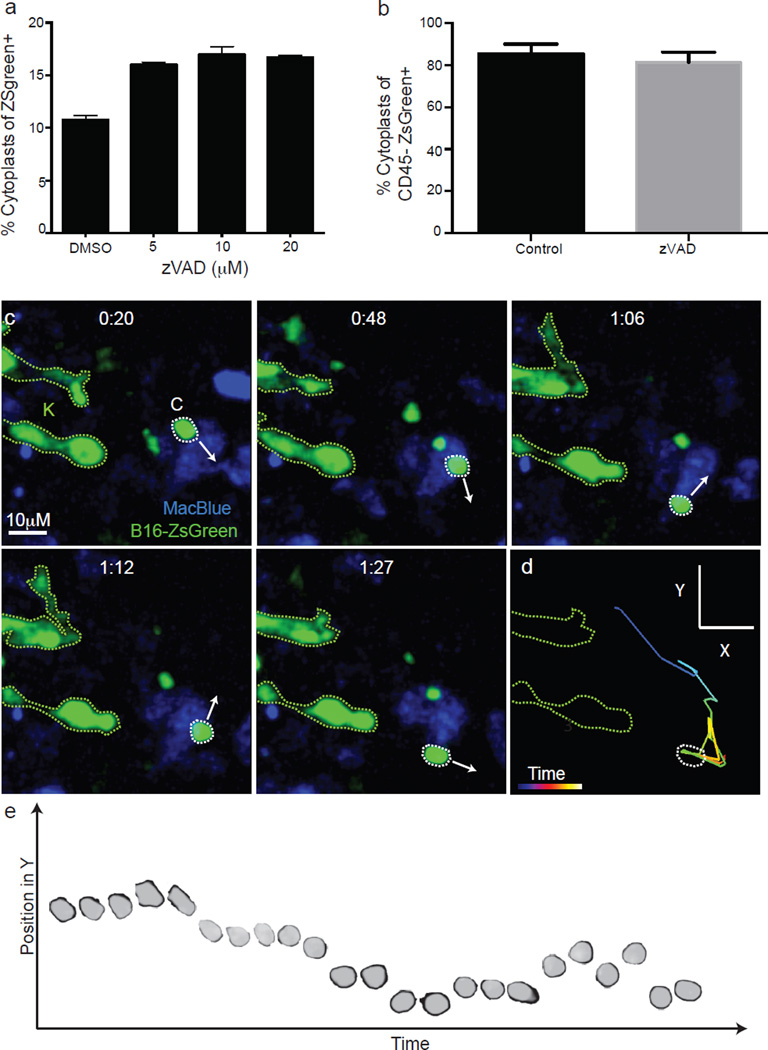
Extended Data Figure 4. Autonomous motility of cytoplasts in vivo.
a. Flow cytometric quantification of cytoplasts in vitro following 24 h treatment with Z-VAD at indicated concentrations. b. Flow cytometric quantification of cytoplasts in vivo from lung digests of mice treated with 10 µg Z-VAD i.v at the time of injection with 2.5 × 10⁵ B15ZsGreen cells (a and b n = 4 per group; no significant difference detected between groups, unpaired t-test, error bars are standard deviation). c, Image series for B16ZsGreen cytoplast migrating autonomously through the lung microvasculature of a MacBlue host. Arrows represent the direction of the trajectory of the cytoplast at indicated time point. These data are associated with Supplementary Video 6. These data are representative of imaging collected from at least 12 mice. d, Representative tracking of a cytoplast from Supplementary Video 6 (and Extended Data Fig. 4c). e, A superposition image of 23 consecutive time points of a cytoplast migrating through lung microvasculature. Image shows the change in position in the Y-axis of direction as defined in d at each subsequent timepoint as the cytoplast migrates up and down the vessel.

