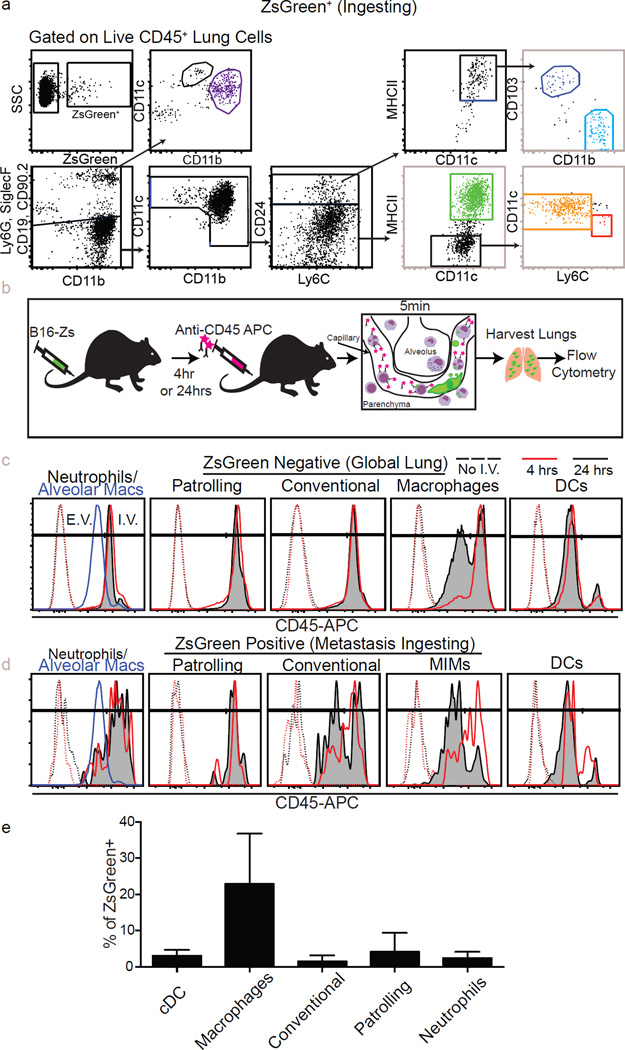
Extended Data Figure 5. Characterization of tumour-interacting myeloid cell waves.
a, Representative gating for total lung myeloid populations. b, Schema detailing method for discrimination of intravascular versus extravascular localization of lung myeloid populations. c, d, Representative histograms of intravascular CD45 staining used to discriminate between intravascular and extravascular localization of lung myeloid cells at 4 and 24 h after injection with B16ZsGreen. Data quantified in Fig. 3d. In the leftmost panels, alveolar macrophages at 24 h after tumour injection are shown as a known control for extravascular staining. c, Total lung myeloids. d, ZsGreen+ myeloid cells. e, Quantification ZsGreen+ myeloid populations by flow cytometry in lungs of mice bearing 2-week subdermal B16ZsGreen tumours, n=4 per group, error bars are standard deviation.

