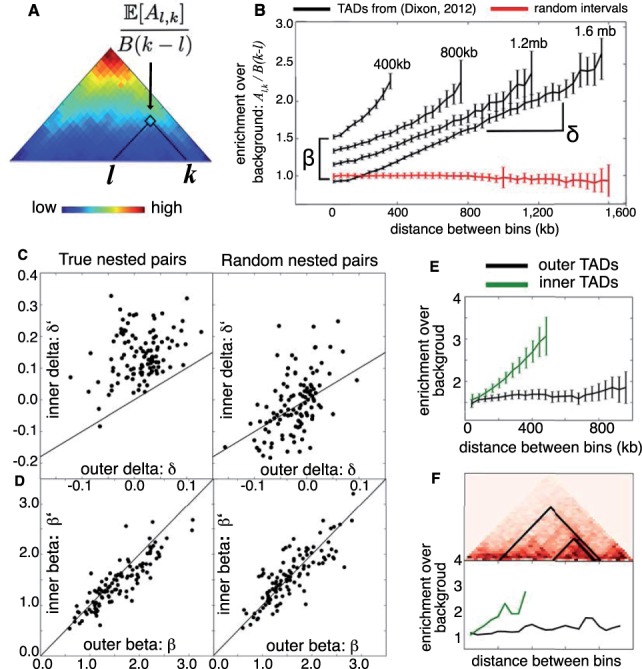
Fig. 2.

TADs from a previous study (Dixon et al., 2012) were each rescaled to match the closest of four sizes (400 kb, 800 kb, 1.2 Mb, 1.6 Mb) using bilinear interpolation. (A) The superposition of all TADs in the 1.2 Mb size class shows that contact enrichment increases with increasing distance between bins. (B) For each size class, the average enrichment of intra-TAD contacts increases linearly with distance. This linear function has slope δ and intercept β. Average enrichment for a set of random intervals is shown in red for comparison. Next, combining TADs from Filippova et al. (2014) and Dixon et al. (2012) revealed 114 nested pairs , where had length 400–600 kb and D had length 800 kb to 1.2 Mb. (C) Nearly all nested pairs (black dots) had (left), while this relationship was not true for nested pairs with randomized positions (right). (D) No similar inequality holds for values of β, although β and are strongly correlated for both real and randomized nested pairs. (E) Rescaling nested TADs so that was 500 kb and D was 1 Mb shows that average contact enrichment for (green) and D (black) follows the linear model [Equation (2)] with and . (F) Examples of nested pair (above) with contact enrichment plotted against distance (below)
