
Fig. 4.
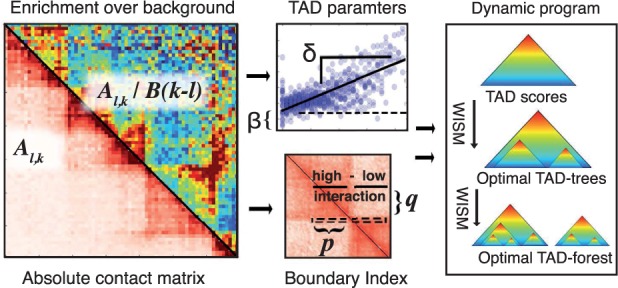
Overview of TADtree algorithm. (A) Beginning with contact matrix A, we compute the fold-enrichment over background for each pair of positions. (B) For each interval , we estimate parameters . (C) Next, for each genomic position i we compute the BI, a 1D statistic that looks for local shifts in interaction frequency at TAD boundaries. (D) Finally, a dynamic program finds TAD trees that maximize the BI and best fit the contact matrix A, then selects an optimal set of TAD trees to form a TAD forest