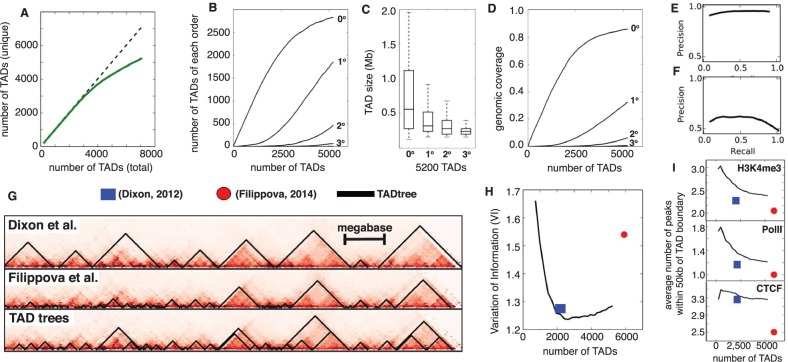
Fig. 5.
(A) Total number of unique TAD output by TADtree (solid green curve) as a function of the value of N, the desired number of TADs. Dotted line is equality. (B) Number of TADs of each order as a function of total number of TADs. As the total number of TADs increases, the number of zero-order TADs (indicating new positions not covered by TADs) start to plateau and high order TADs appear. (C) Higher order TADs have smaller sizes and (D) lower coverage of the genome, consistent with their nesting inside larger TADs. (E, F) Precision-recall curves comparing TADs found by TADtree with those reported in Dixon et al. (2012). (G) Example of TADs from TADtree (bottom) and two previous studies (Dixon et al., 2012; Filippova et al., 2014). (H) TADs found by TADtree (black line) are more similar (lower VI) to those found in a recent analysis of higher resolution Hi-C data (Rao et al., 2014), compared with TADs reported in Dixon et al. (2012) (blue square) and Filippova et al. (2014) (red disk). (I) Number of ChIP-seq peaks for CTCF, PolII and the histone modification H3K4me3 within 50 kb of TAD boundary (y-axis) versus total number of TADs (x-axis) for TADtree TADs (black line), Dixon et al. (2012) (blue square) and Filippova et al. (2014) (red disk). TADtree shows greater enrichment for all four chromatin marks

