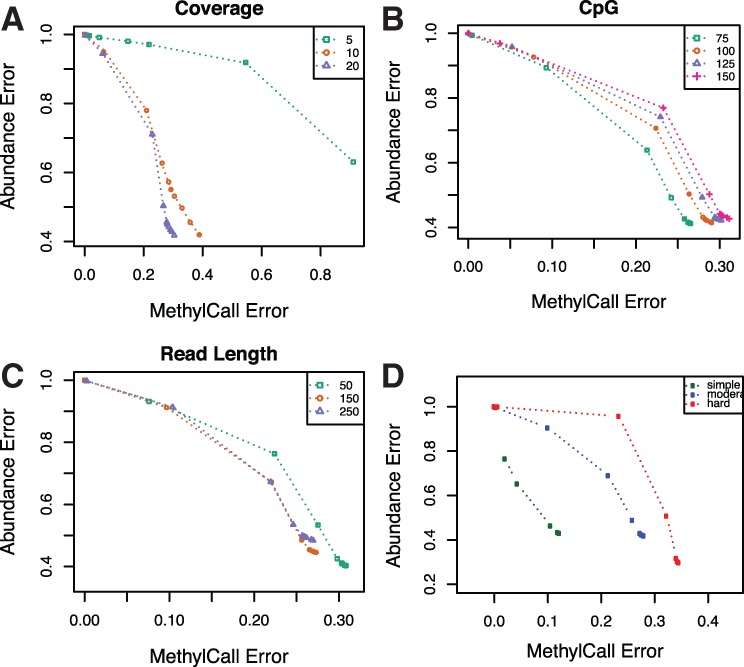
Fig. 3.

Average abundance error versus average methylation call error in different setting of simulation and various thresholds in moderate complexity of patterns. Points correspond to increasing threshold on methylation error between matched patterns. Panels show the effect of different (A) coverage, (B) number of CpG sites and (C) short read length on error. (D) Average abundance error versus average methylation call error in different simulated pattern complexity with fixed coverage, number of CpG and short read length
