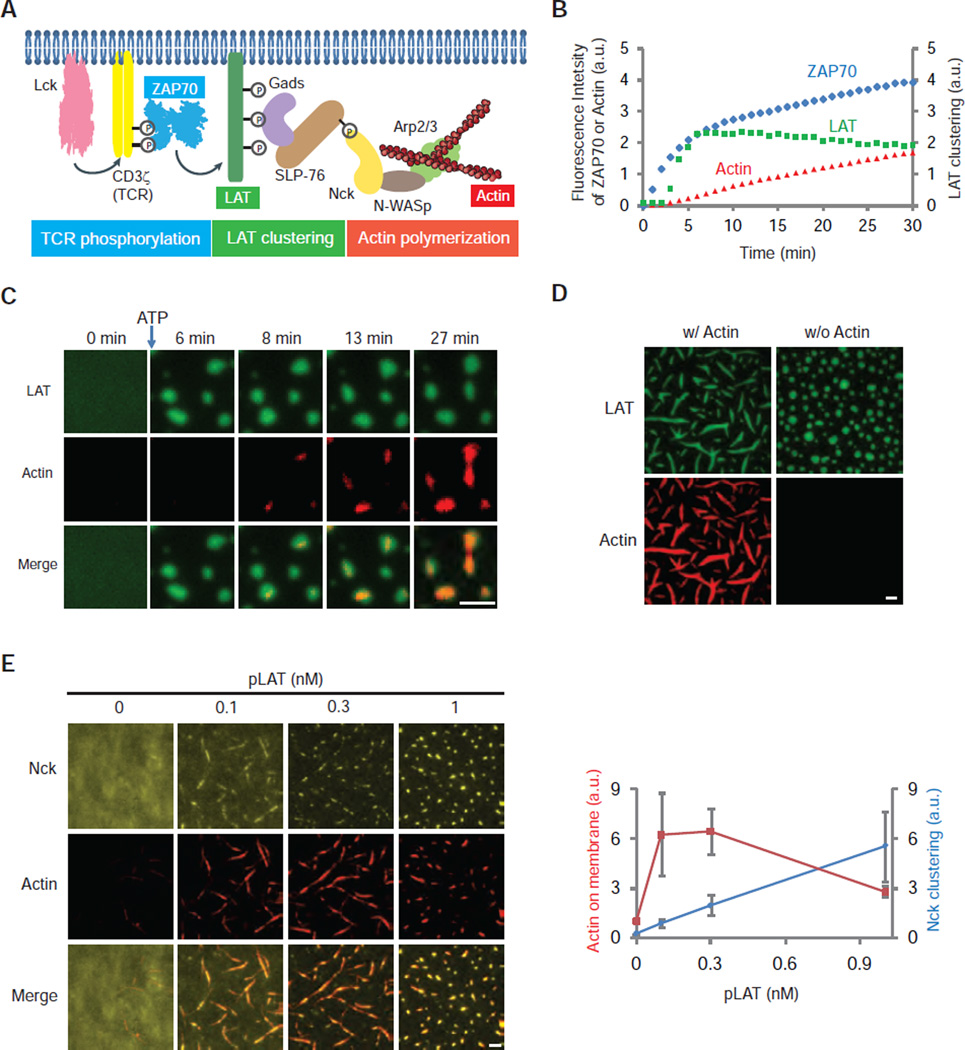
Fig. 4. LAT clustering promotes actin polymerization.
(A) Schematic of the reconstituted signaling pathway from CD3ζ/TCR phosphorylation to actin polymerization. ZAP70-505-Star, LAT-Alexa647, and actin-Rhodamine serve as reporters for TCR phosphorylation, LAT clustering, and actin assembly, respectively. Lck, CD3ζ, and LAT were membrane attached through a polyhistidine tag and incubated with other components in solution. ATP was then added to trigger the signaling cascade. Input: same for Lck, CD3ζ, pLAT-Alexa647, and ZAP70-505-Star as described in Fig. 3A. The rest are 250 nM Gads, 125 nM SLP-76, 500 nM Nck, 250 nM N-WASp, 2.5 nM Arp2/3 complex, 500 nM actin (5% Rhodamine labeled), and 0.5 mM ATP-Mg. (B) Time courses of ZAP70 membrane recruitment, LAT clustering, and actin polymerization in the reconstituted assay after addition of ATP at time 0. LAT clustering was quantified as variance of fluorescence intensities on membranes (See Methods). (C) TIRF imaging showing actin assembly on the LAT clusters. Scale bar: 2 µm. (D) TIRF imaging of pLAT-Alexa647 and actin-Rhodamine 45 min after adding ATP to the reaction. Input: same as in Fig. 4A except with higher concentrations of components of actin and actin regulators (500 nM SLP-76, 1000 nM Nck, 500 nM N-WASp, 5 nM Arp2/3 complex, 1000 nM actin (5% Rhodamine-labeled)). Scale bar: 2 µm. (E) LEFT: TIRF microscopy images of His10-Nck-Pacific Blue and actin-Rhodamine on the bilayer. Nck (150 molecules/µm2) was attached to the bilayer and N-WASp (5 nM), Arp2/3 complex (0.25 nM), actin (200 nM; 5% Rhodamine labeled), and 0.5 mM ATP-Mg were in solution. Increasing concentrations of His-tagged pLAT were added as indicated along with Gads and pSLP-76. At 0.1 nM pLAT, Gads, and pSLP-76 concentrations were 8 nM and 4 nM, respectively. As pLAT concentration was increased, more Gads and pSLP-76 were added to maintain a constant ratio of the clustering components. Scale bar: 2 µm. RIGHT: Mean actin fluorescence (red) and Nck clustering level (blue) quantified as variance of His10-Nck fluorescence intensity, are plotted for increasing concentrations of pLAT. Shown are mean ± s.e.m. (N=3 independent experiments).

