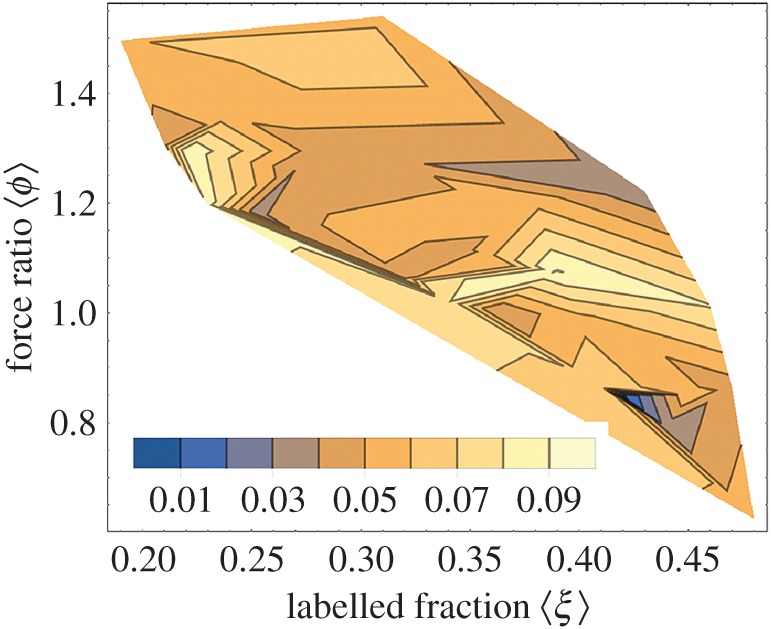
Figure 10.

Contour plot of χ2 for the cFGFP(+) approximation of FGFP(+) indicating the best-fitting average labelled fraction  and force ratio
  relating the isometric forces of tagged and native cross-bridges (see equation (3.1)). The χ2 minimum is indicated in deep blue and according to the legend.
