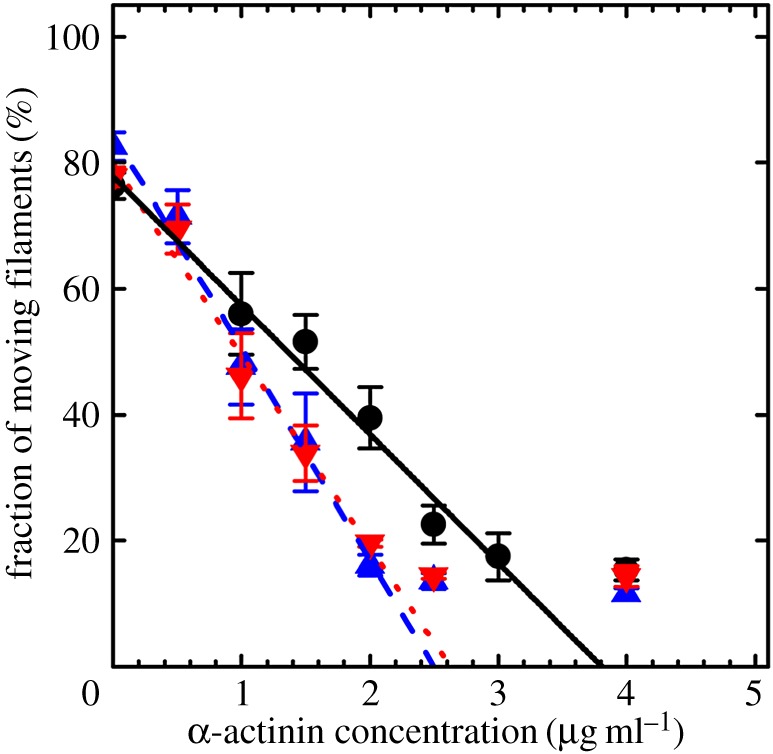
Figure 6.

The percentage fraction of moving actin filaments versus α-actinin concentration for Zmys (black circles), Zmys-GFP (blue up triangles) and Zmys-HCRLC (red down triangles). Error bars indicate standard deviation for data from more than 1000 actin filaments at each α-actinin concentration and from three independent protein preparations. Lines extrapolated to the x-intercept indicate relative isometric force. Data at the highest α-actinin concentrations where linearity fails are excluded from the fits, because α-actinin is unable to fully inhibit actin filament sliding.
