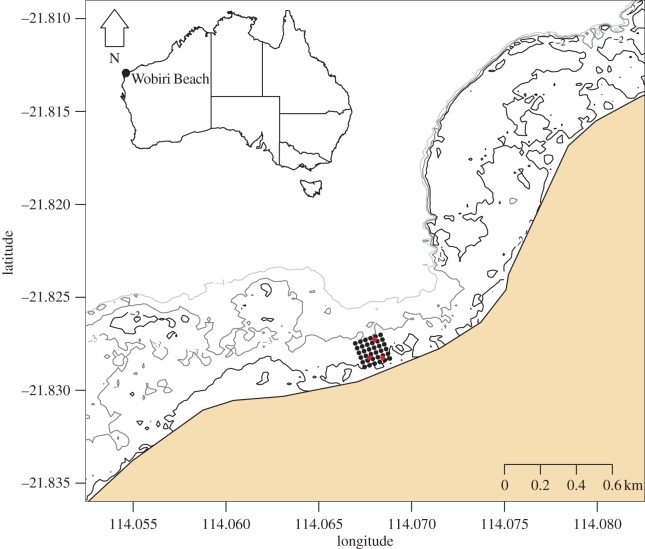
Figure 1.
Map of the study site at Wobiri Beach, North West Cape, Western Australia and inset map of Australia showing the position of the study site. Map shows acoustic receivers in black and reference tags in red. Three bathymetry contours are shown: 2 m in black, 3 m in dark grey and 4 m in light grey.

