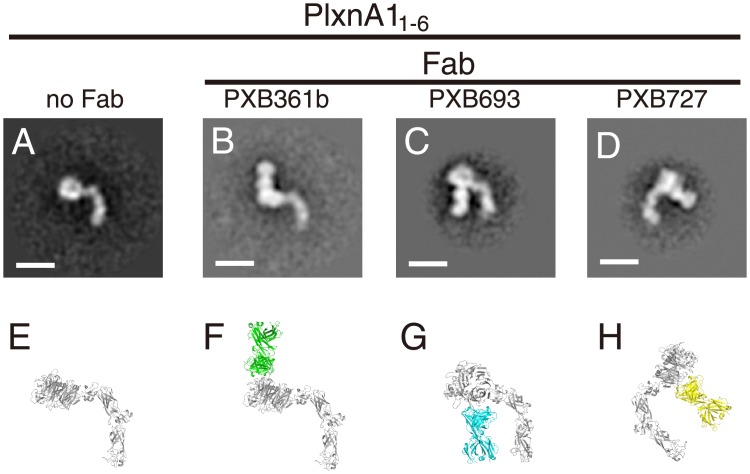
Fig 4. Docking models of the Fab-PlxnA1 complex.
(A-D) A representative 2D projection average was derived for each PlxnA11-6-Fab complex by the further refinement of the images shown in Fig 3. Bar: 100 Å. (E-H) Cartoon representation of the modeled PlxnA11-6 protein (gray) upon simulated Fab binding. The viewing orientation for the complex models was arbitrarily chosen to maximize shape similarity with the EM images.

