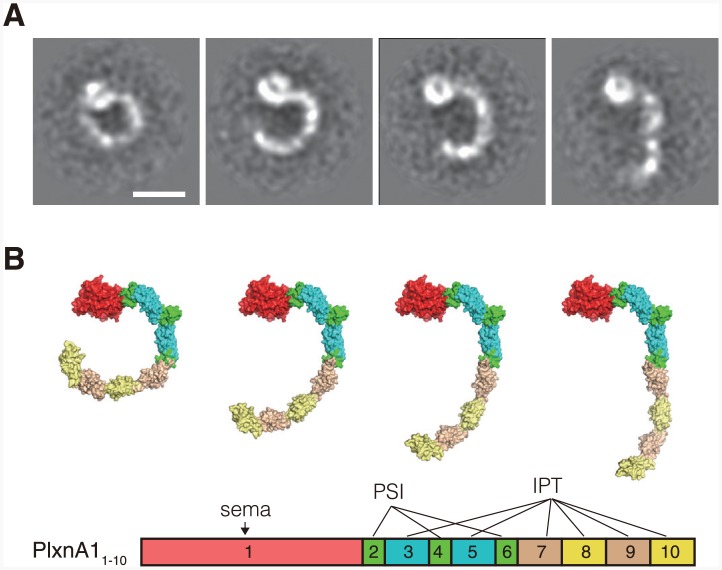
Fig 6. Flexibility of the lower stalk region of the PlxnA1 ectodomain.
(A) Four popular class averages for PlxnA11-10 taken from Fig 5. (B) Surface rendering of the structural model of PlxnA11-10. The lower stalk region (i.e., domains 7–10 corresponding to the 3rd to 6th IPT domain) is shown in 4 different orientations relative to the upper portion. The domains are color-coded as indicated by the schematic shown at the bottom.

