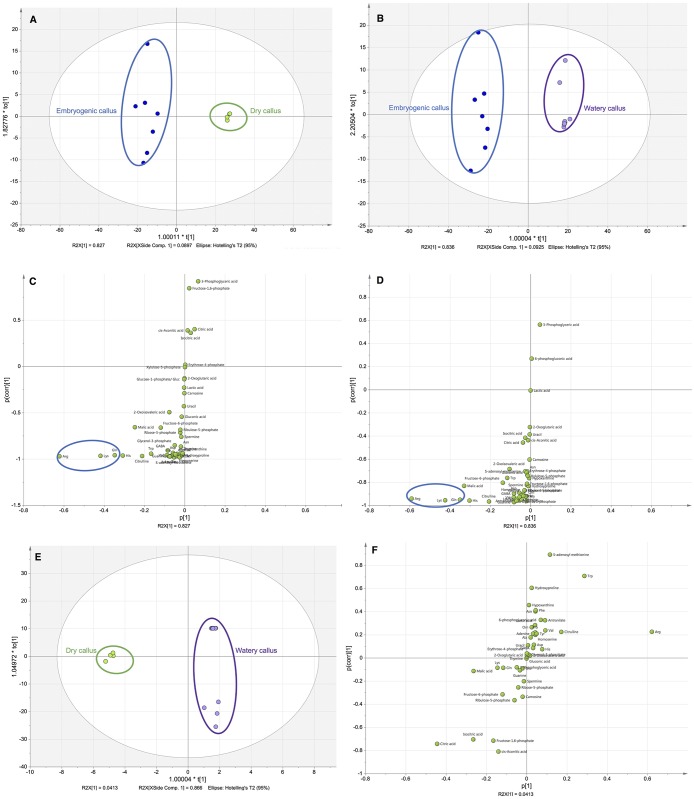
Fig 2. Primary metabolite variables associated with different callus types from B. rotunda (n = 3 biological replicates).
A: Orthogonal Partial Least Square-Discriminant Analysis (OPLS-DA) plot for embryogenic callus (EC) and dry callus (DC); B: OPLS-DA plot for EC and watery callus (WC); C: Blue ellipse in the S plot highlights metabolites associated with EC versus DC with p-value-<0.05, D: Blue ellipse in the S plot highlights metabolites associated with EC versus WC with p-value<0.05, E: OPLS-DA plot for DC and WC; F: S plot showing metabolite comparison between DC and WC.

