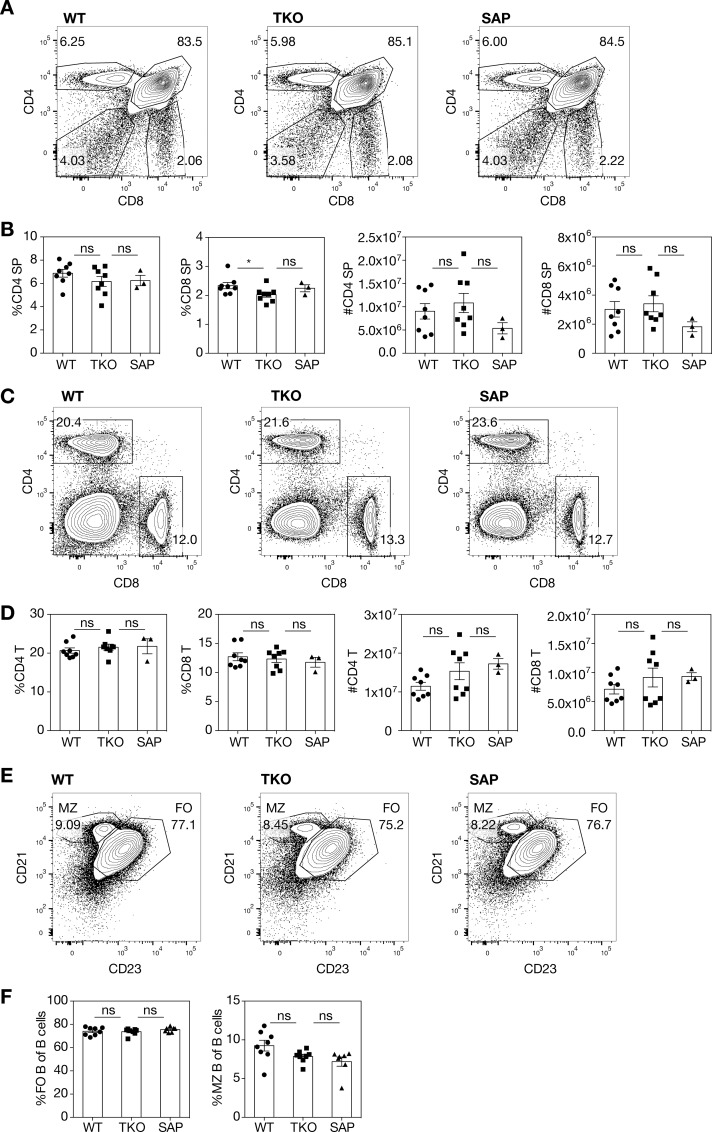
Fig 2. Normal development of thymic conventional αβ T cells, peripheral CD4+ and CD8+ T cells, and splenic B cells in TKO mice.
(A) Representative flow cytometry plots and (B) quantitation of single positive thymocytes. Data were pooled from 2 independent experiments, n = 3–8 mice/genotype. (C) Representative flow cytometry plots and (D) quantitation of splenic CD4+ and CD8+ T cells. Data were pooled from 2 independent experiments, n = 3–8 mice/genotype. (E) Representative flow plots and (F) quantitation of follicular (FO) and marginal zone (MZ) splenic B cells. Data were pooled from 2 independent experiments, n = 7–8 mice/genotype. Error bars show s.e.m., group means were compared by t-test, ns = not significant, *p<0.05.

