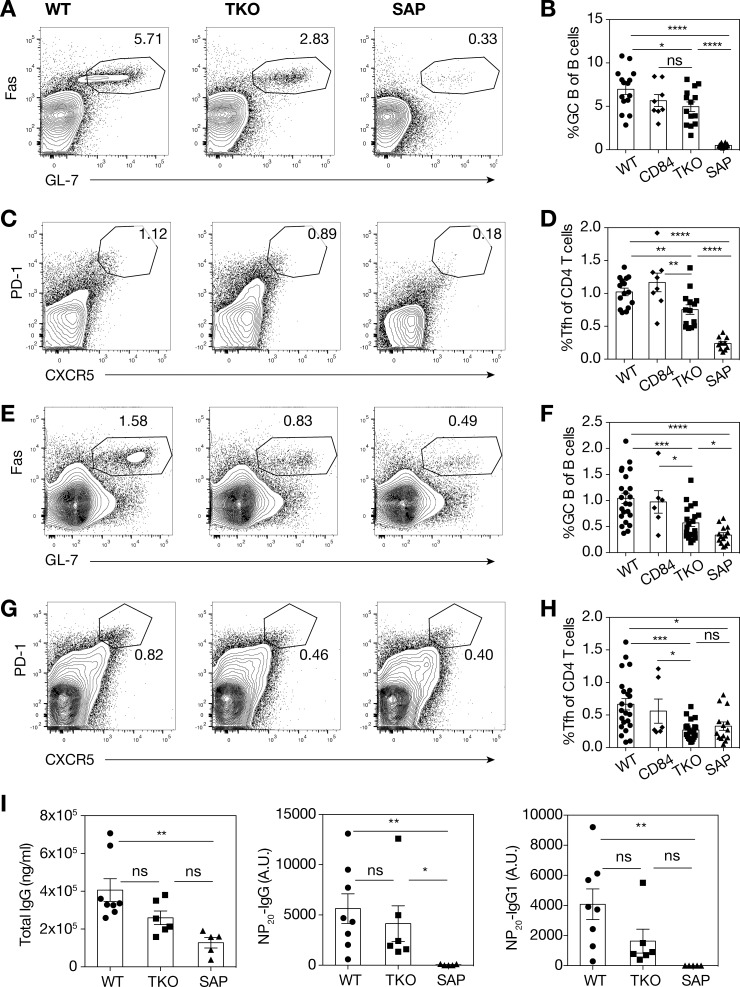
Fig 5. TKO mice show mildly reduced responses to immunization with sheep RBC or NP-ova.
(A) Representative flow cytometry plots and (B) quantitation of GC B cells, (C) representative flow cytometry plots and (D) quantitation of Tfh cells from spleen, day 8 post-immunization with sheep RBCs. Data were pooled from 3 independent experiments, n = 10–15 mice/group. (E) Representative flow cytometry plots and (F) quantitation of GC B cells, (G) representative flow cytometry plots and (H) quantitation of Tfh cells from spleen, day 7 post-immunization I.P. with NP-ova and Sigma Adjuvant System. Data were pooled from 4 independent experiments, n = 14–23 mice/group. GC B cells were gated on live CD19+B220+Fas+GL-7+ cells, Tfh cells were gated on live CD4+B220-CXCR5hiPD-1hi cells. (I) Serum antibody titer ELISA, day 7 post-immunization with NP-ova and Sigma Adjuvant System. Concentration of antibodies for individual mice (NP-specific concentrations are relative to a pooled positive control), A.U. = arbitrary units. Data is representative of 1 of 2 independent experiments, n = 5–8 mice/group. Error bars show s.e.m., group means for (B, D, F, H) were compared by t-test, group means for (I) were compared by nonparametric Kruskal-Wallis test, followed by Dunn’s post hoc test, ns = not significant, *p<0.05, **p<0.01, ***p<0.001, ****p<0.0001.

