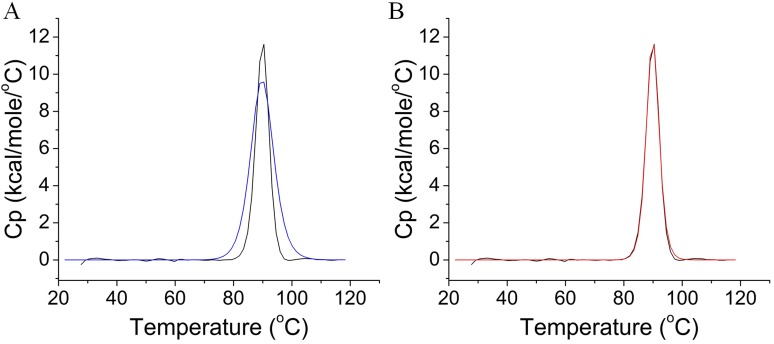
Fig 4. Heating of CbMan5A as analyzed by DSC.
A and B: Fitting of the DSC data to either a simple 2-state (A) or a non-2-state model (B). The black solid lines in A and B are the raw DSC data, while the blue and red solid lines in A and B are the fitted curves with the 2-state or non-2-state model, respectively.

