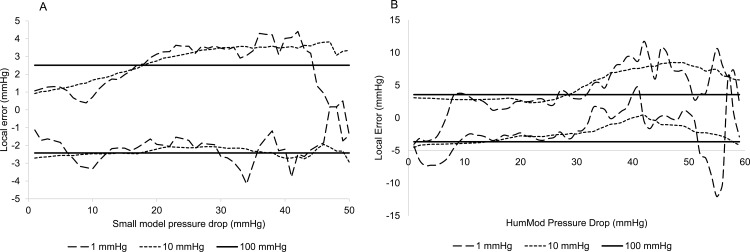
Fig 4. Rolling average error.
The rolling average error between integrative model and surrogates is computed for 1, 10, and 100 mmHg radii (dashed, dotted, and solid lines, respectively) in Small (3A) and HumMod cases (3B). In both cases, there is a tendency to bias towards negative error at small pressure drops, and towards positive error in large pressure drops.

