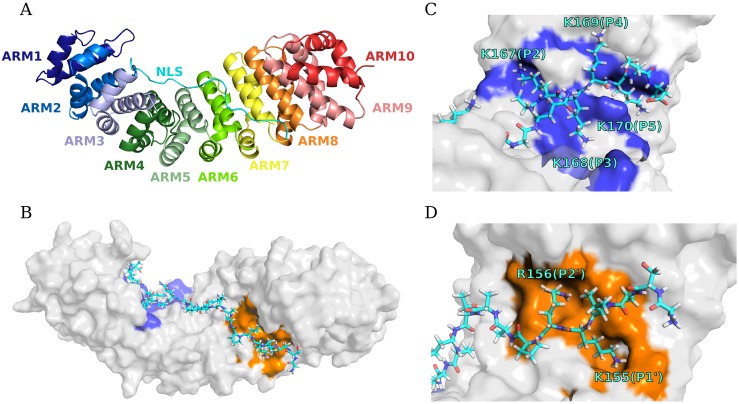
Fig 2. The starting structure of Impα-NplNLS for MD simulations.
(A) The Impα as a cartoon diagram colored based on each ARM repeat as a rainbow spectrum from N-terminal (blue) to C-terminal (red) and the NplNLS as a cyan cartoon diagram positioned in an antiparallel configuration compared to Impα. (B) The surface representation of Impα with the NplNLS as a cyan stick diagram, indicating both major (blue) and minor (orange) binding sites. (C) The major site zoom indicating positions P2–P5 and (D) the minor site zoom in P1’ and P2’. In both sites, the positively charged side chains are positioned in the main pockets of the Impα binding core.

