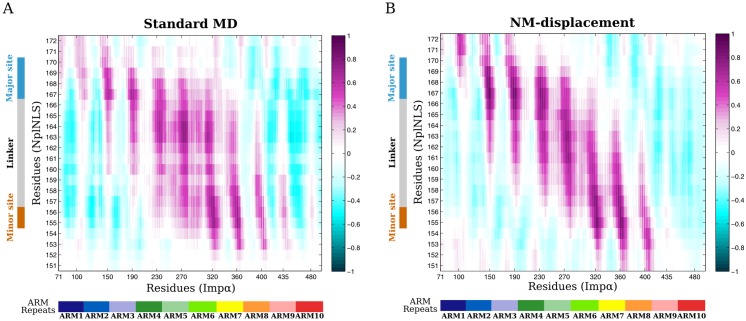
Fig 6. Heatmap of cross-correlations between Impα and NplNLS.
(A) Trajectories from standard MD simulations (300 ns ensemble) and (B) NM-displacement (ensemble from references structures 67,730 ps, 207,080 ps and 274,970 ps) were used for the calculation of correlations. A color bar indicates the degree of correlation from anti-correlated (negative values) to correlated (positive values) residues. The X and Y axes, respectively, show the position of each ARM repeat in relation to the Impα sequence and the NplNLS residues in contact with the protein binding sites.

